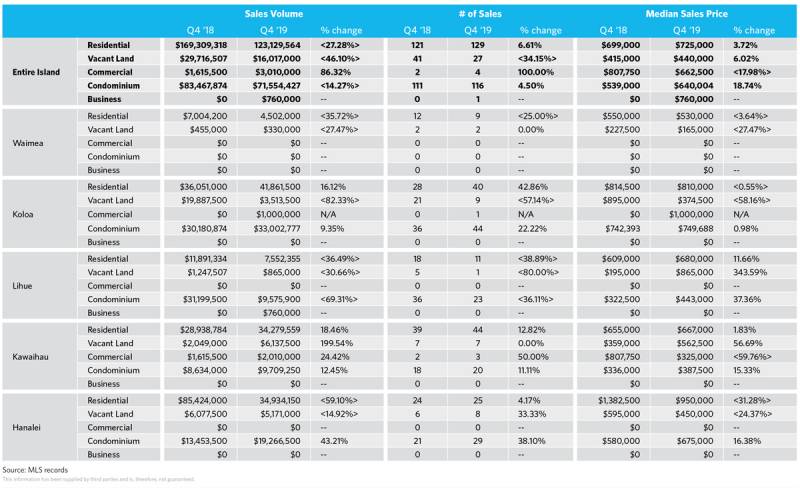
2019 is officially in the books. Compared to 2018, many sales metrics are down. North Shore residential sales volume for the quarter dropped some 59%, and island wide sales volume dropped more than 27%. A look at year to date data tells a rather similar story, with year on year island wide sales volume down 29.8% from $751M to $527M and 60% on the North Shore from $359M to $142M.
There’s more to this story, however. If we look at the sales metric of number of sales, we see that the fourth quarter of 2019 actually outperformed Q4 ’18 with 129 island wide residential sales in Q4 2019 versus 121 in Q4 2018 and 25 residential North Shore sales in the 2019 period versus 24 sales in 2018. If we look at this metric year on year, 2019 was only down 3.2% in number of sales compared with 2018, from 598 to 579. With nearly the same amount of market activity in number of sales, but a significant reduction in overall sales volume, one inference that can be drawn is that 2019 was a slow year for the high-end market, but the overall real estate market appears robust and healthy.
To consider this further, we compared 2019 statistics to those from 2017 and 2016. The 579 island wide sales in 2019 were greater than the 552 residential sales in 2017 and the 568 residential sales in 2016. Additionally, the $527M in sales volume in 2019 was rather on par with the $537M of residential volume in 2017 and the $556M of residential volume in 2016. Having delved a little deeper into these numbers, we see that the market performed just as well in 2019 as it did in other recent great years, albeit the market did not grow. This is a testament to the extent to which 2018 was an extraordinary year.
If you’d like to explore the numbers a bit deeper, check out the market snapshot below or via this link for an enlarged version.
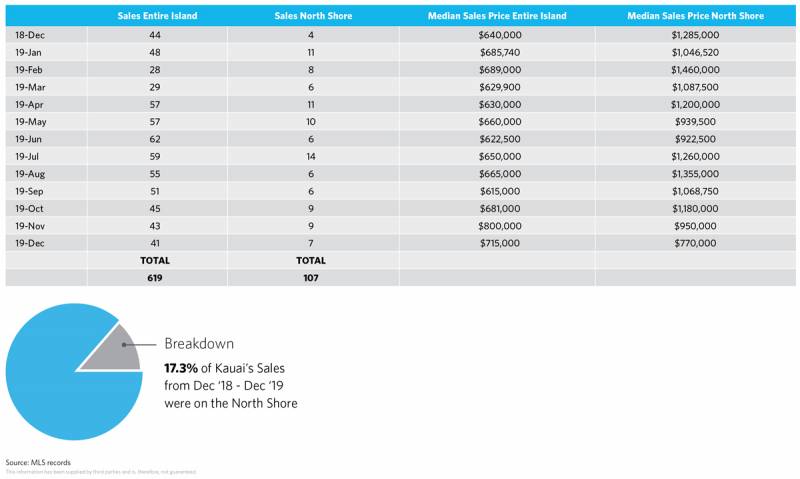
Monthly Sales and Median Price Statistics
Below you will find a chart featuring the monthly residential sales and median sales prices for the entire island and the North Shore. The statistics below fit the evident story from the broader statistics above. Number of sales, both island wide and for the North Shore, appear on par for Q4 considering the variation of the preceding sample. One would expect to see the reduction in median sales prices, given the maintained level of sales and the reduction in North Shore total volume.
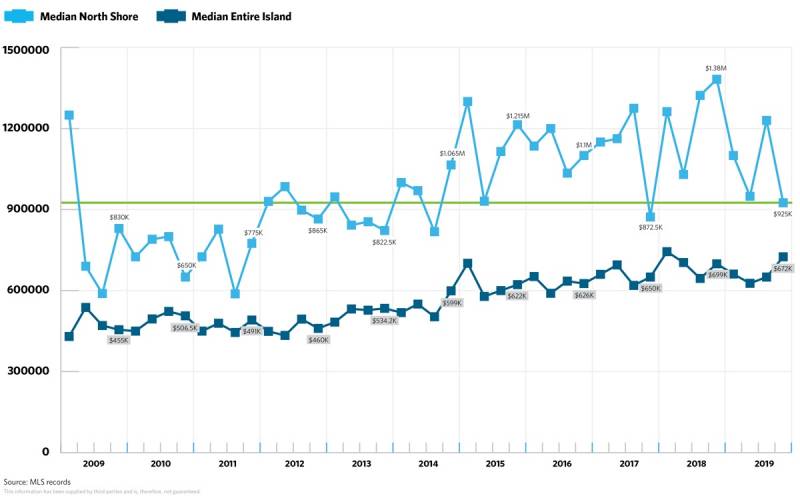
Quarterly Median Sales Prices
This chart continues to exemplify what we have seen over the past two years, a leveling of prices as prices vary around a relatively stable mean. This price range continues to be at a level that is both high across this ten year sample, as well as historically.
Market cues for 2020 have been very positive through the start of the new year. The holiday window saw a lot of activity in the high end with several significant properties going into escrow and a general buzz of activity that reminds us of the start to 2018!

Leave your opinion here. Please be nice. Your Email address will be kept private, this form is secure and we never spam you.