December 2023 Economic Forecast & Market Report
In summary for the third quarter, we saw a reversal in the downward price appreciation trend. Despite higher interest rates, housing prices remain stable due partially to historically low housing supply. Interest rates have nearly tripled in the past nearly 3 years causing loan originations & buyer purchasing power to go off a cliff. Hawaii continues to lead the nation with the highest housing costs. Nearly 3 times the national average. At Hawaii’s median income ($52k), only a 3rd of the population can afford the median priced homes. Supply indicators remain historically low. Closing volumes continue to shrink as the real estate market contracts. Market velocity is 23-29 days to sell property and Hawaii continues to maintain Pre-Covid economic activity numbers into 2023.
PRICE APPRECIATION
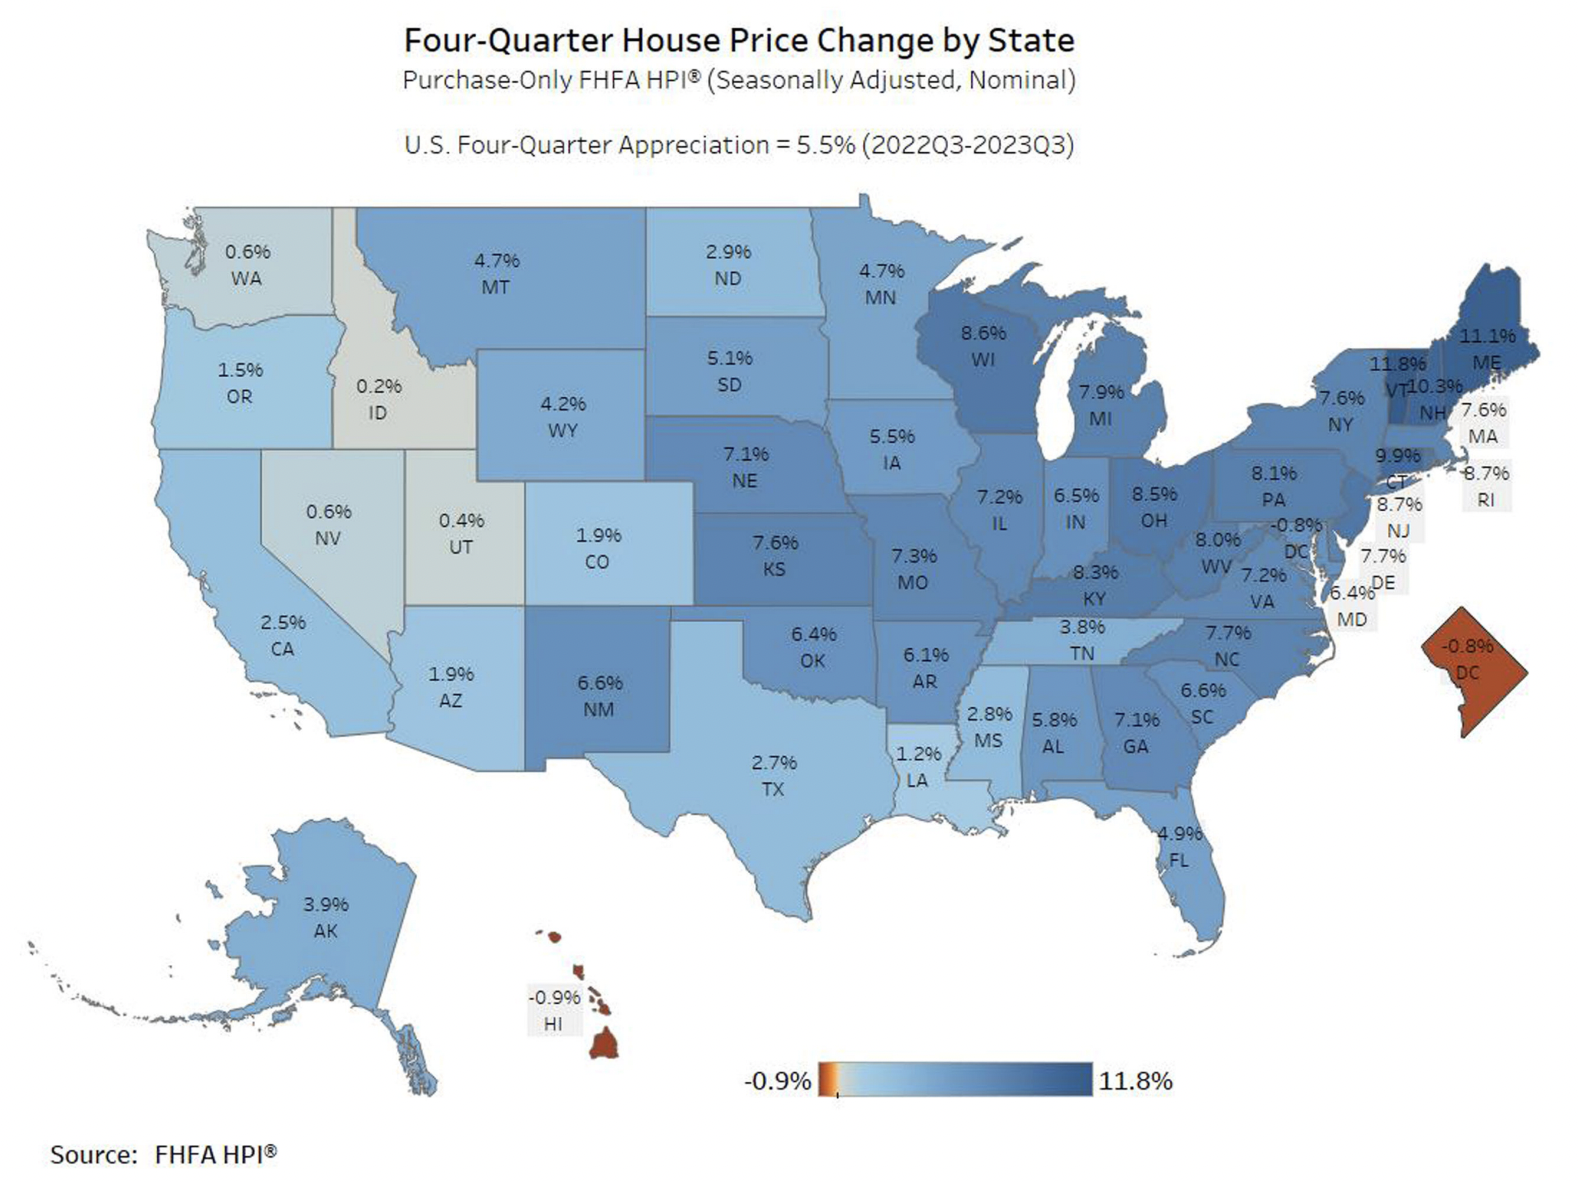
If we look at the big picture, US house prices rose 5.5% on average, in the 3rd quarter of 2023, year over year. We only saw Hawaii and the District of Columbia, with slight price declines.
This is the 47th consecutive positive quarterly price gain, since 2012.
PRICE CHANGE BY STATE
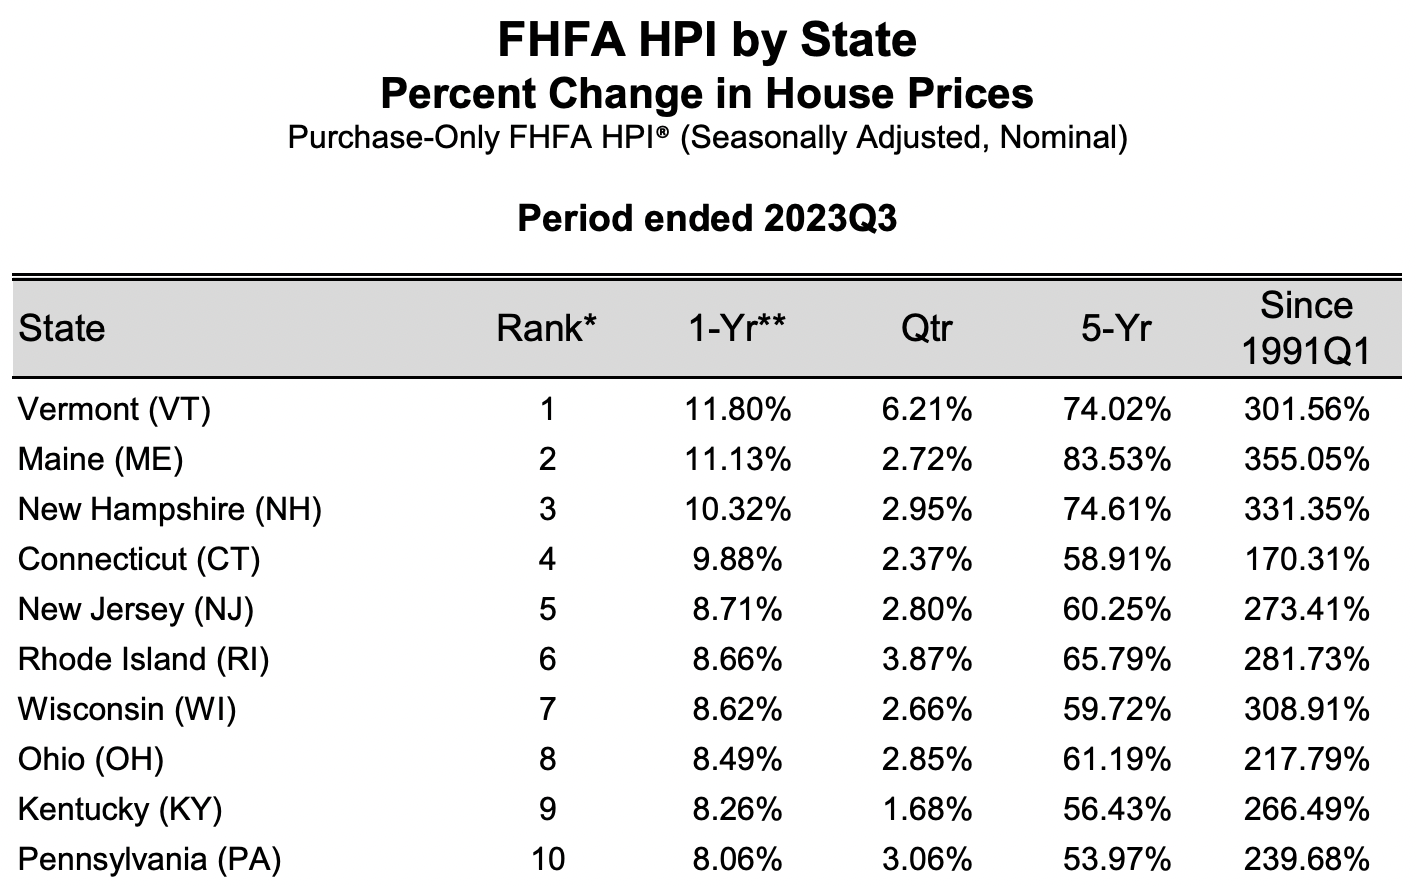
Vermont and Maine lead the nation with about 11% price appreciation each. The state of Hawaii is ranked 51st, in the country, with almost a 1% dip, YOY.
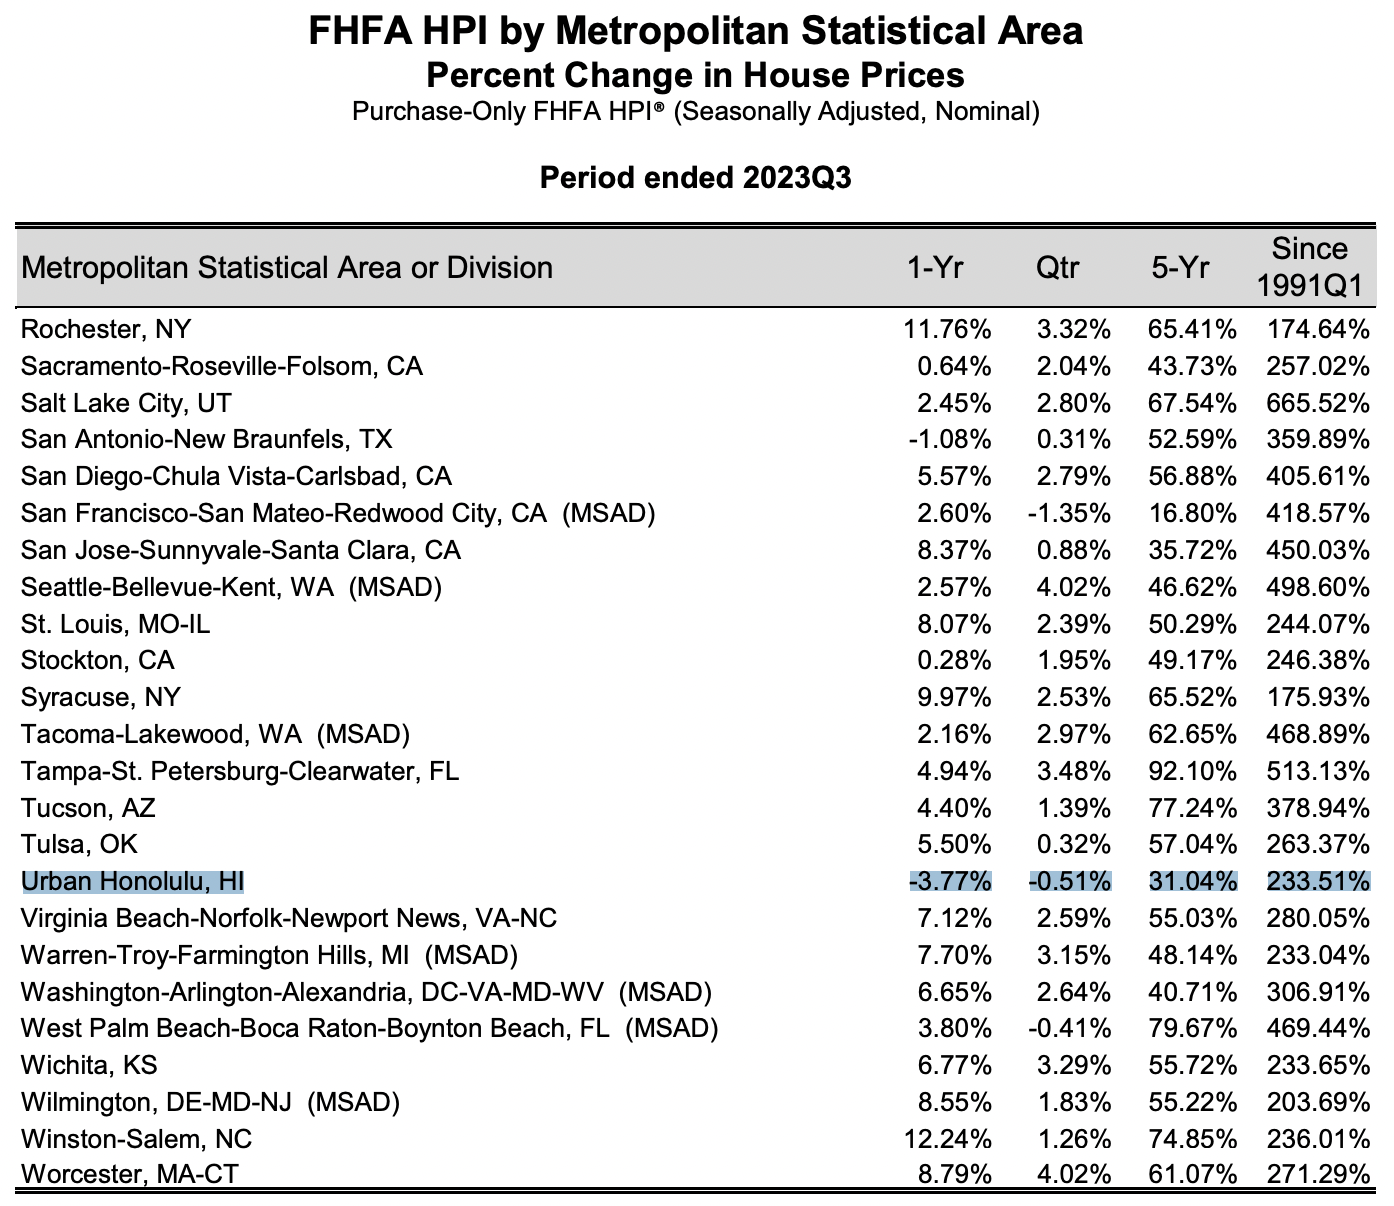
PRICE CHANGE BY CITY
The #1 ranked city, for price appreciation, is Albany-Schenectady-Troy, NY with 12%, YOY. he 2nd highest was Winston-Salem, NC also with about 12%, YOY (FHFA.gov).
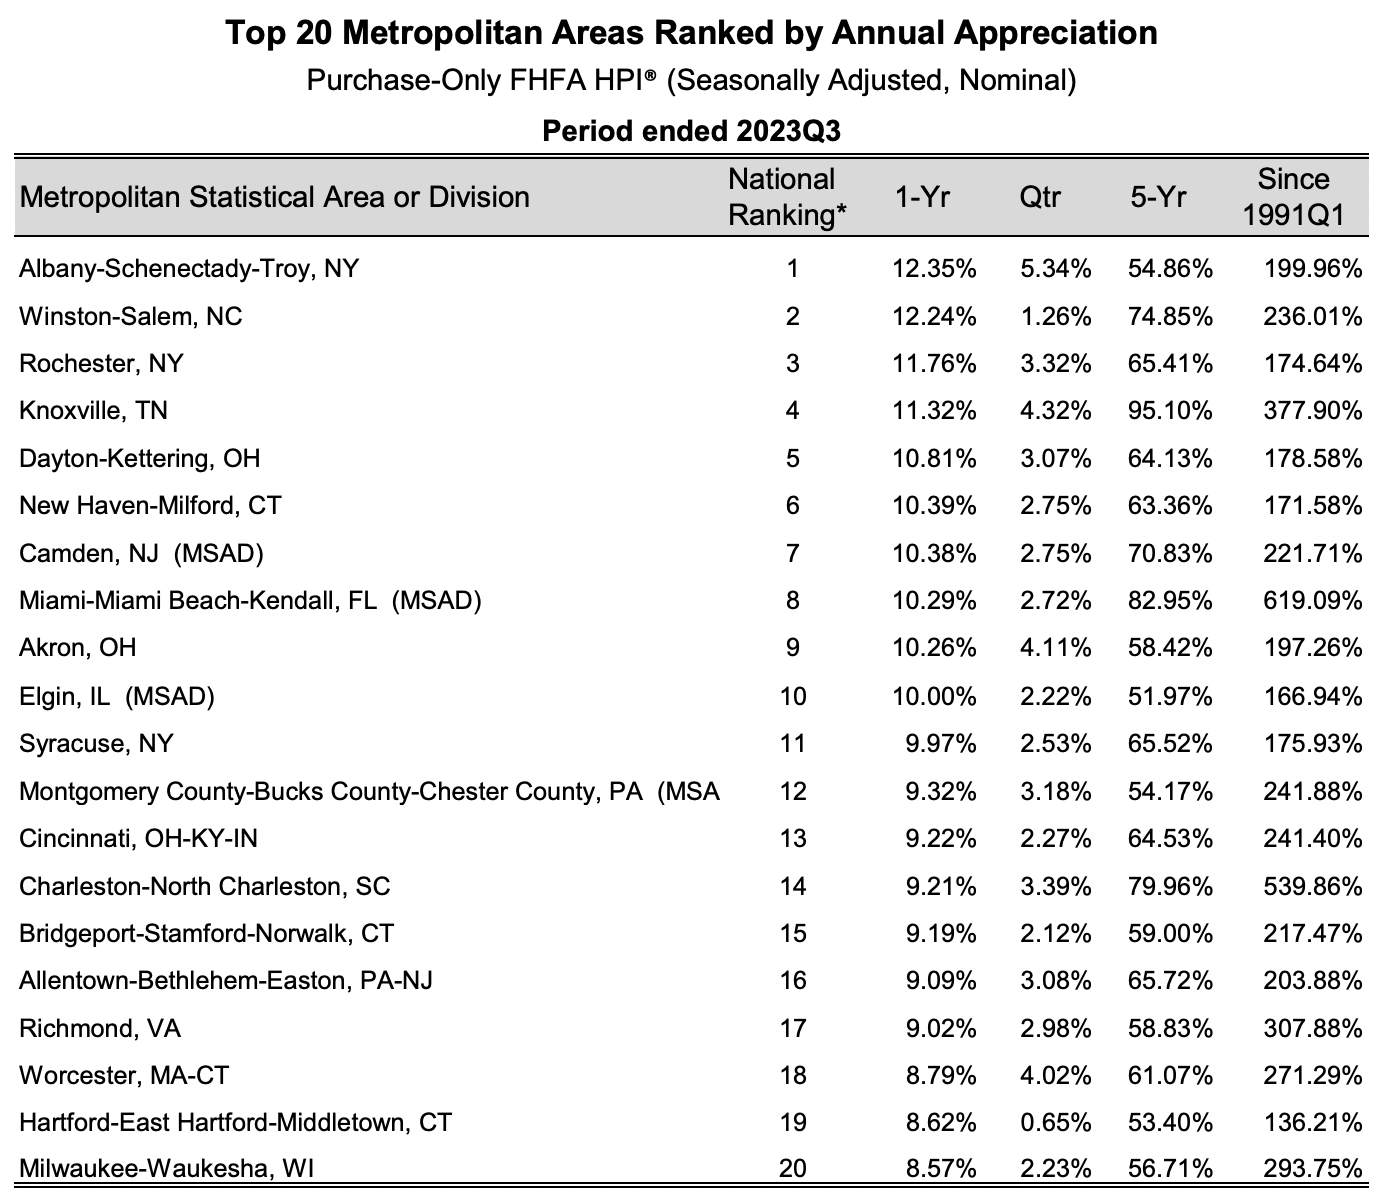
It is interesting to note that in the 1st quarter of 2023, 6 of the top 10 cities, for price appreciation, were in Florida. Now, in the second half of 2023, there is only one city in Florida in the top 10. Also interesting to see is that ½ of the top 10 cities are in the North East states of CT, NY & NJ. Years prior to that, price appreciation was dominated by the Mountain Region. It goes to show that real estate is truly local and ever evolving.
The City and County of Honolulu is down about 4%, year over year.
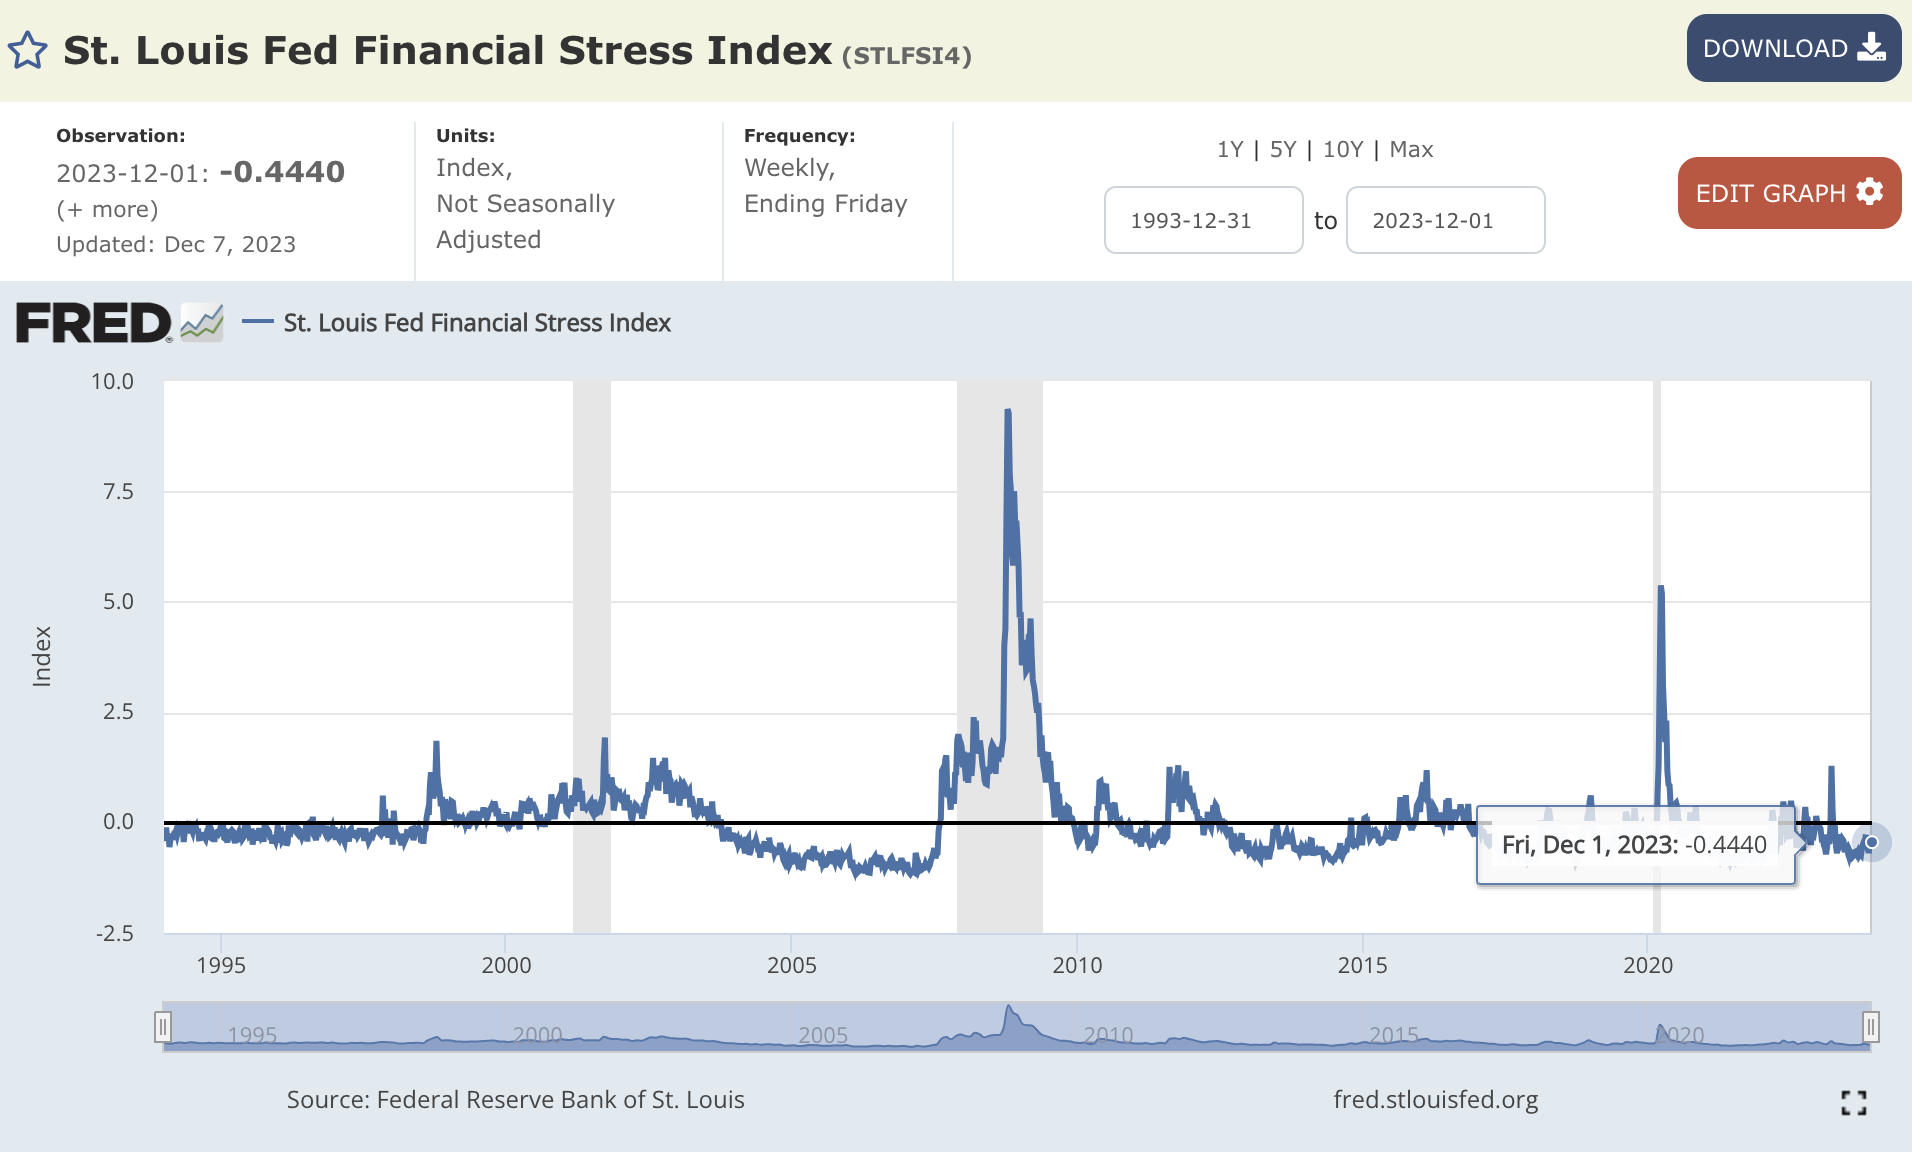
FINANCIAL STRESS INDEX
The nation’s Financial Stress Index, as of December 1st, 2023, was -.44 points. The Financial Stress Index is significantly lower compared to our last three recessions highlighted in gray. Where the index was at 5.48 points in 2020, and nearly 9 points during the financial meltdown of 2008.
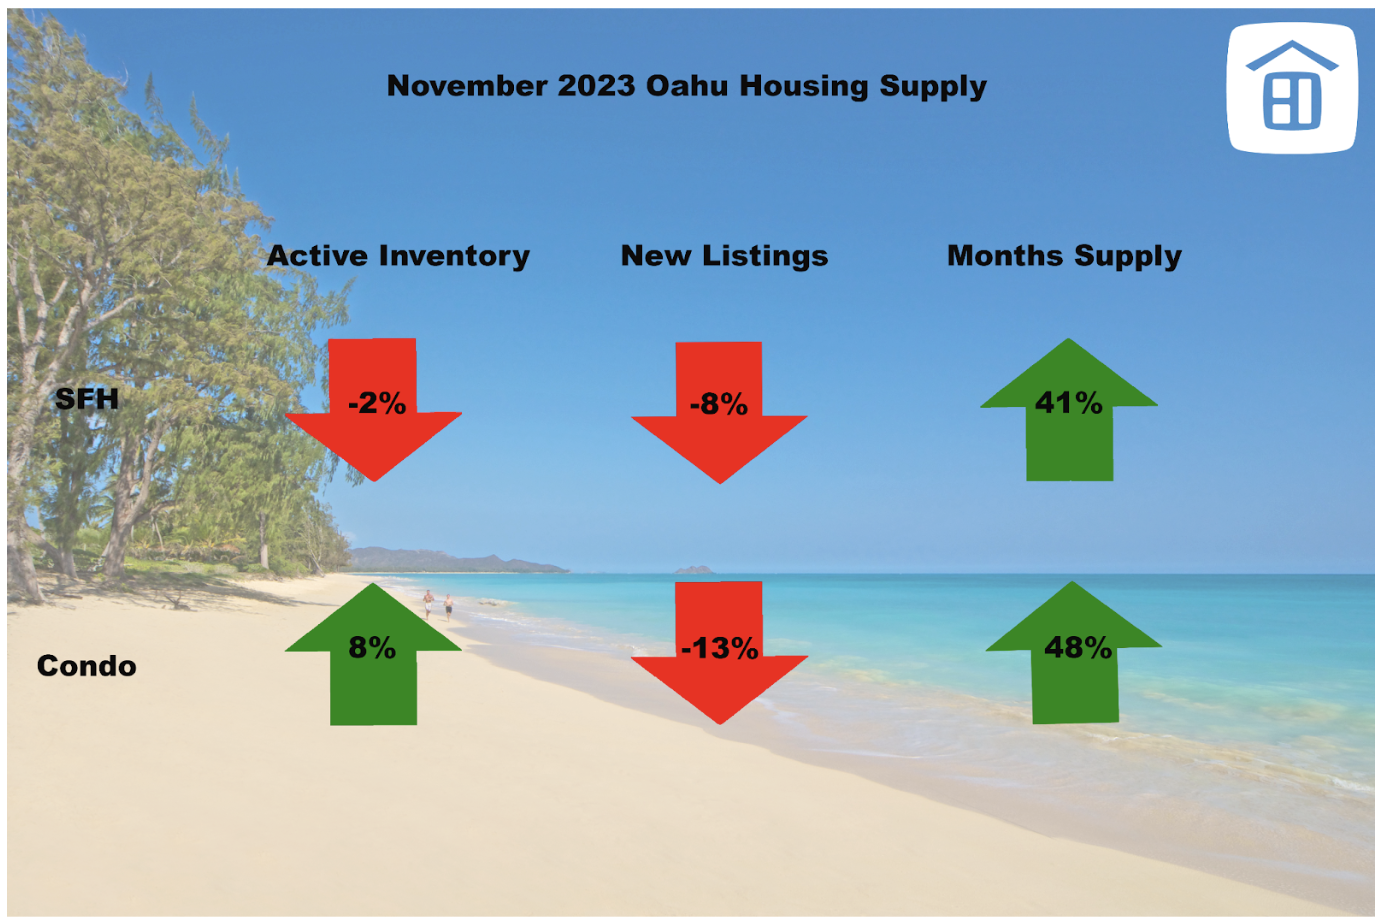
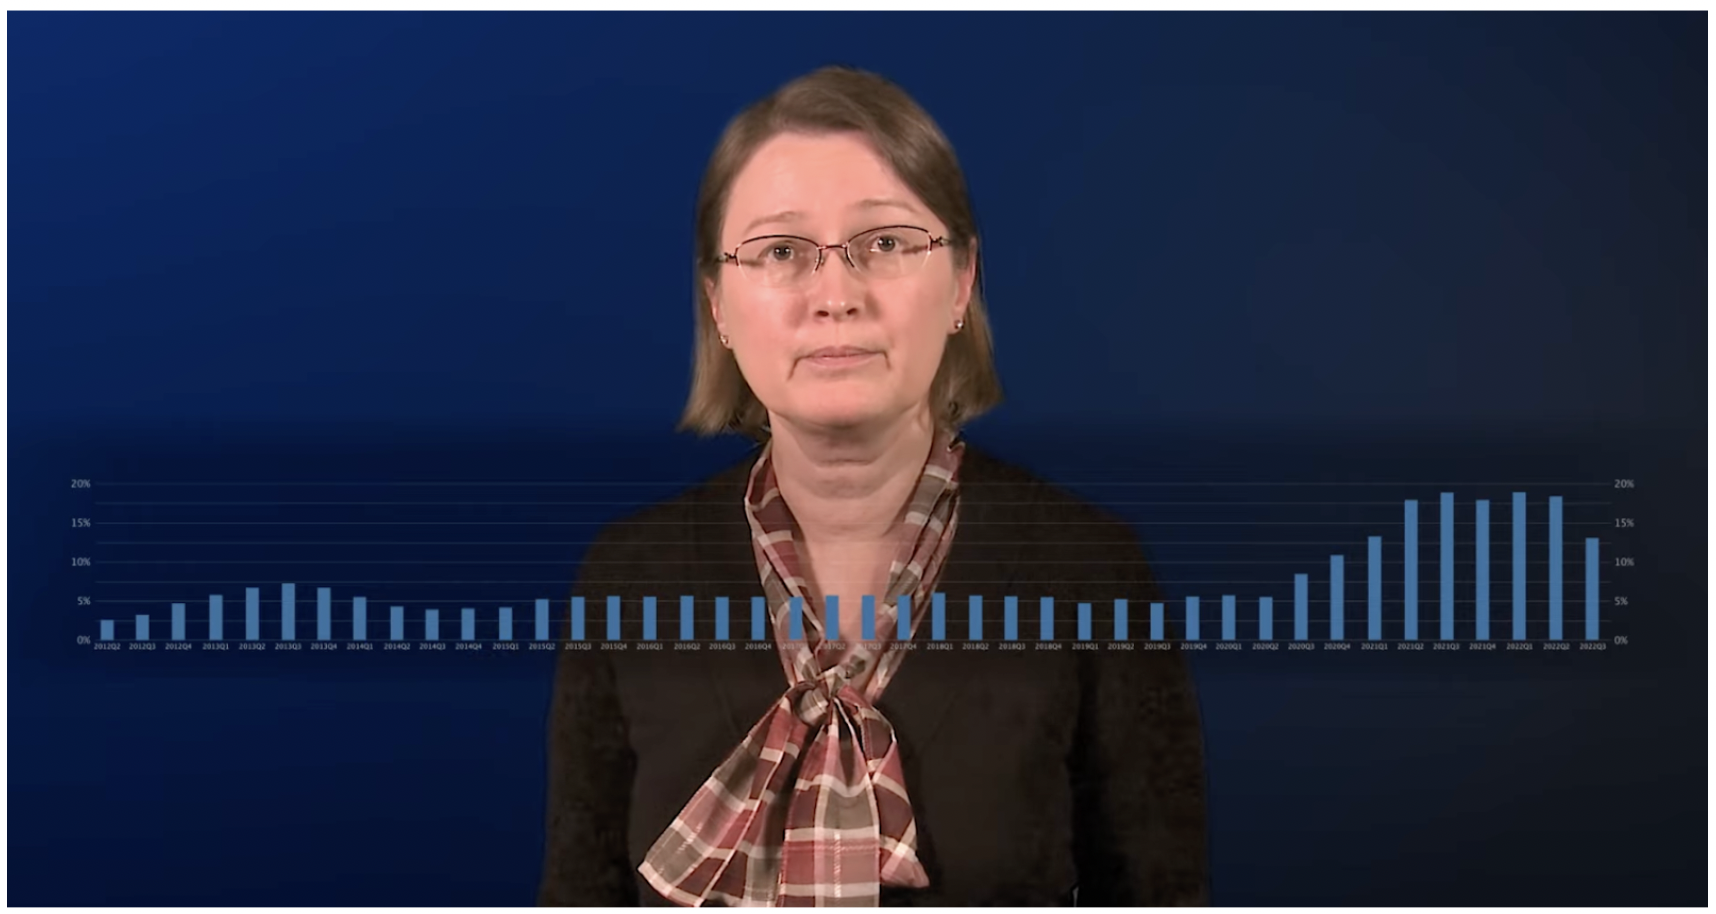
MONTHS SUPPLY
The supply indicators in November of 2023, continue to be indicative of a market in flux and change. Months supply has been steadily rising. In the Spring of 2022, months supply for Single Family Homes was at its lowest point of 1.5 months. Now in the Winter of 2023, months supply has doubled to just over 3 months. For condos, their lowest supply numbers were in the Winter of 2021, where condos dipped below 1 months supply and their months supply numbers have tripled since then. It is also important to note, that although months supply has been increasing, it is still ridiculously low at around 3 months of supply.
In the chart below, we can see supply creeping up slowly, but it is still very low. Months supply below 6 months, is considered a “seller’s market.”
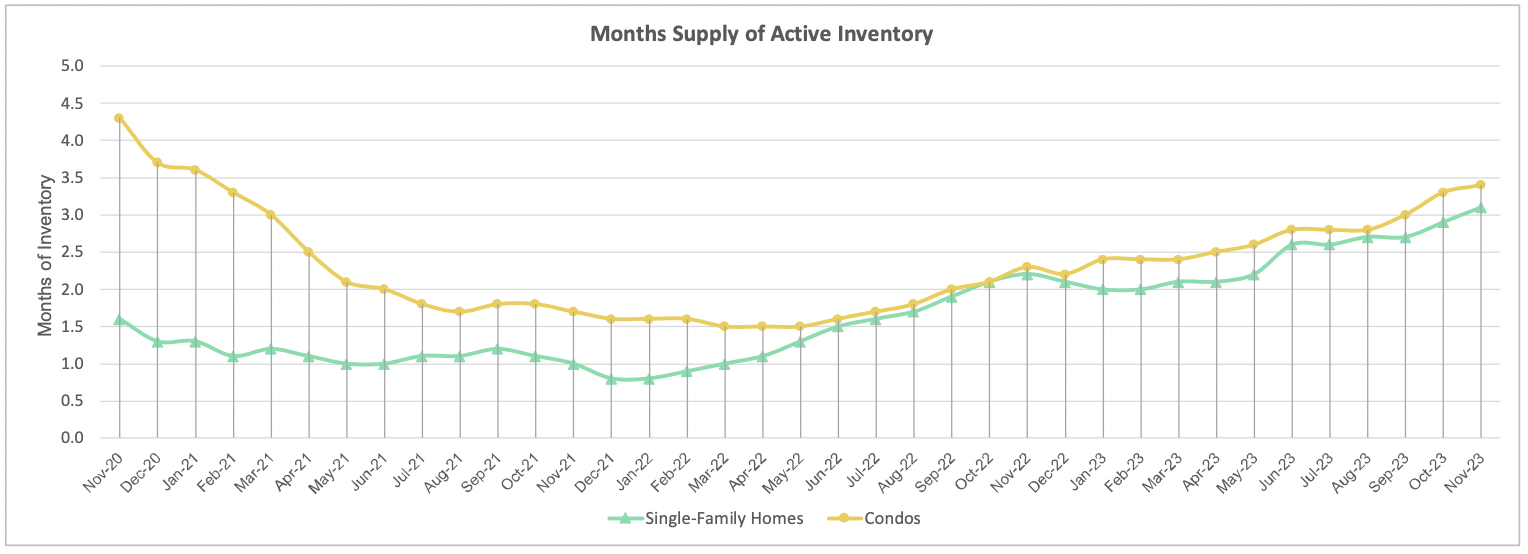
Source: HicentralMLS
There are 557,000 housing units in the state of Hawaii. In the past 5 years, housing stocks have increased 27,000 units and 12,000 permits were issued for single-family homes. Hawaii leads the nation in the most restrictive land use regulations in the nation. On average, a permit in Hawaii will take 1 year to process.
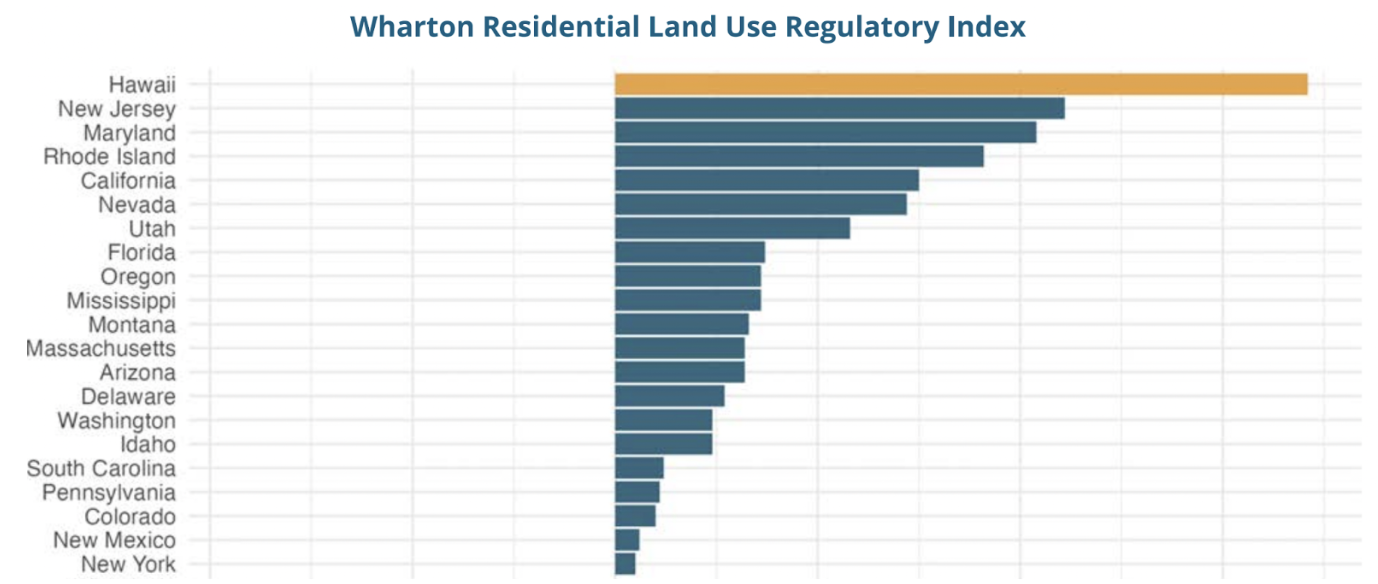
Source: UHERO
SALES VOLUME
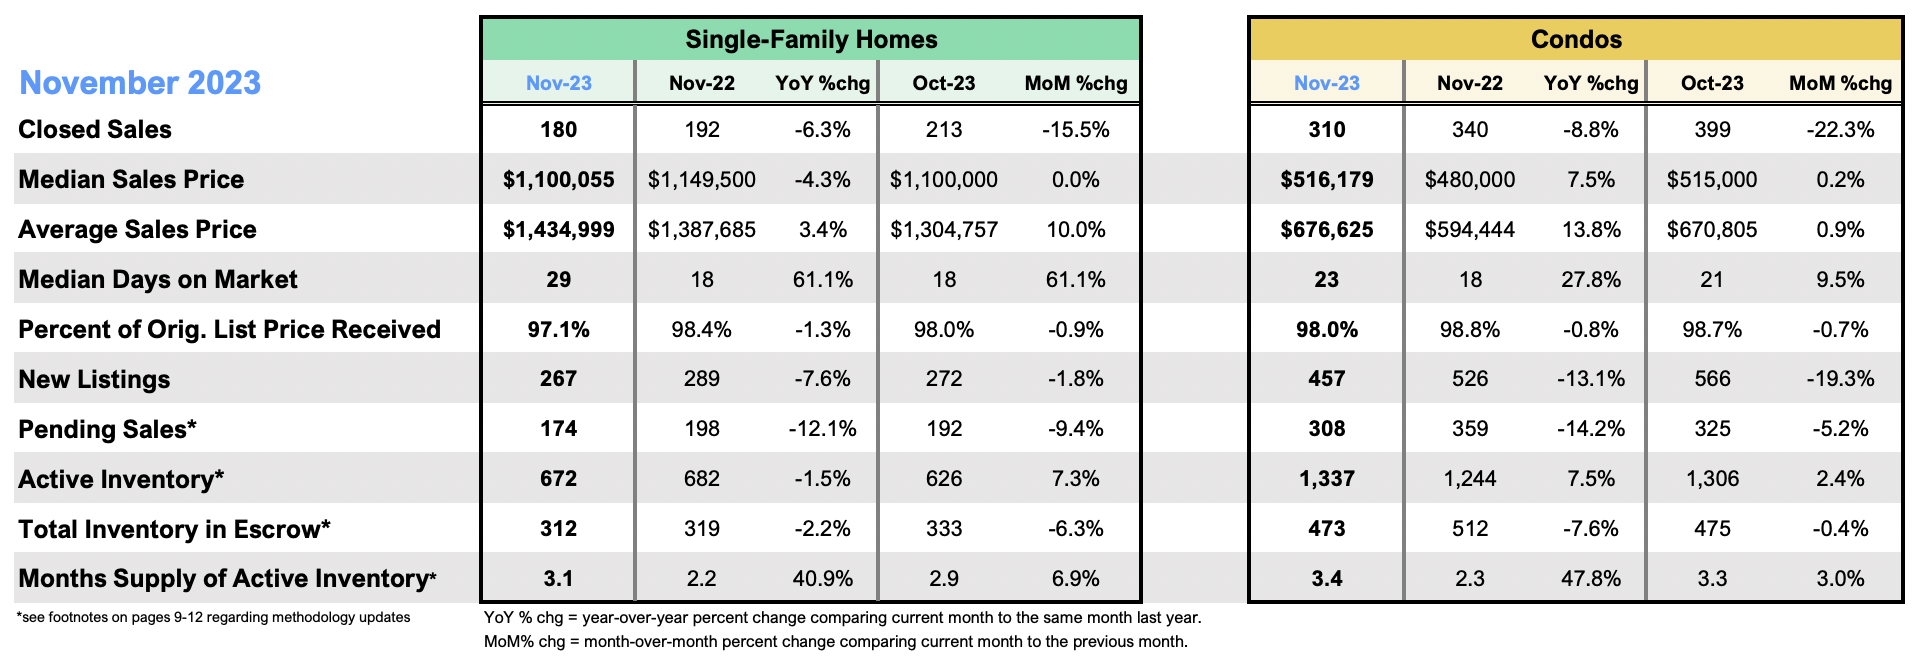
Median sales prices are down about 4%, for single family and up about 8% for condominiums, in November 2023. Sales volumes are off around 6% & 8% for single family and condos, respectively. In November, days on market grew around 61% to 29 days to sell single family and up 28% to 23 days for condos.
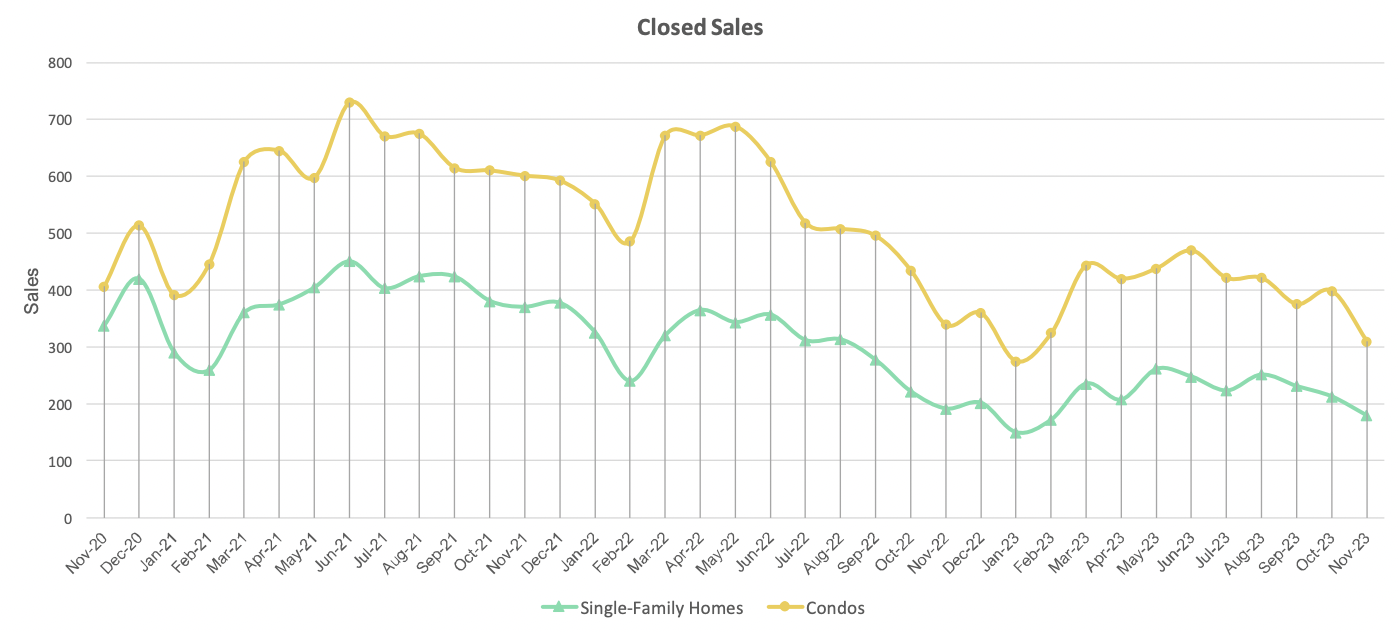
Traditionally, we see the closing volume of single family homes and condominiums move in lockstep with each other. When covid hit in the Spring of 2020, we saw a sharp decline in the closings and demand for condominiums (highlighted in blue). Perhaps, largely attributable to the desire for people to not have shared HVAC systems, common amenities & shared elevators. This was the first time in recorded Hawaii real estate history, where we witnessed the “decoupling” of single family homes and condominiums. We can see further highlighted examples, where closings are moving independently of each other.
Comparison of home values across the nation
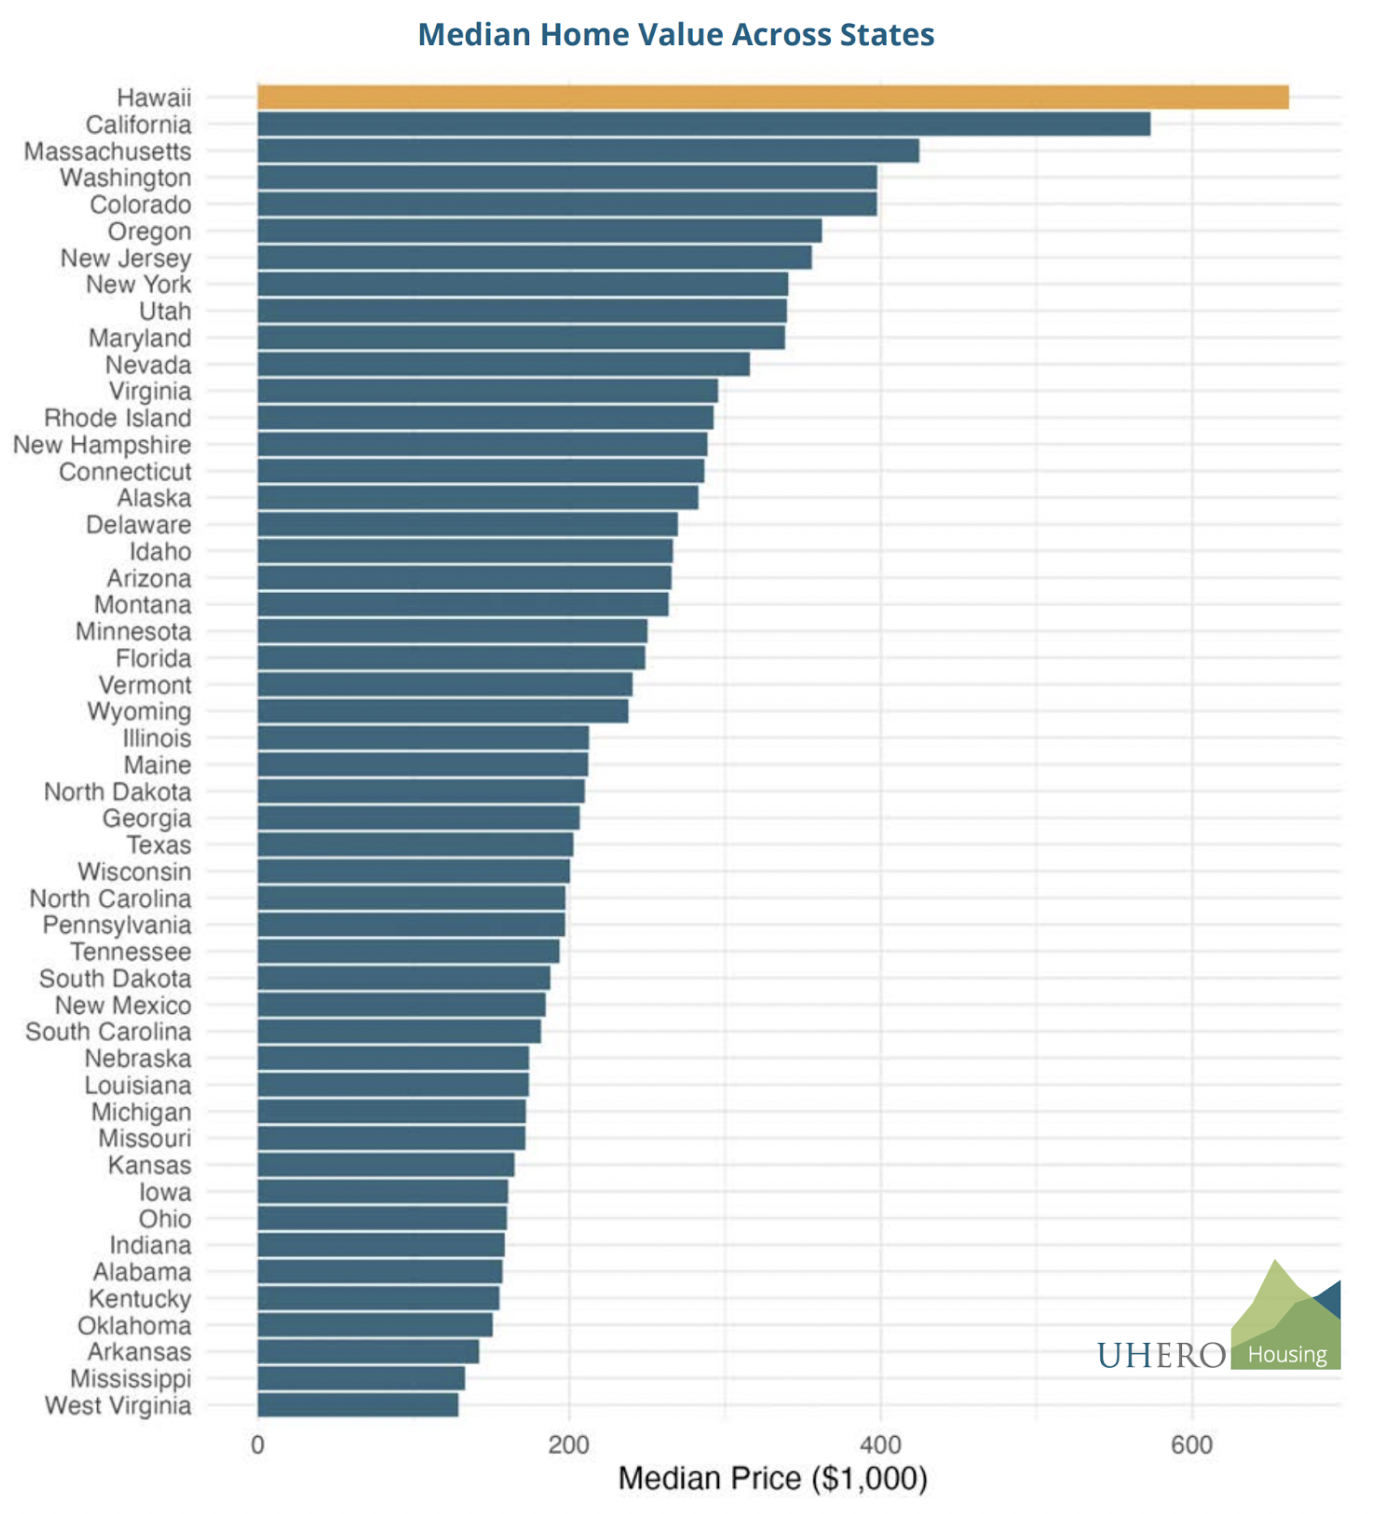
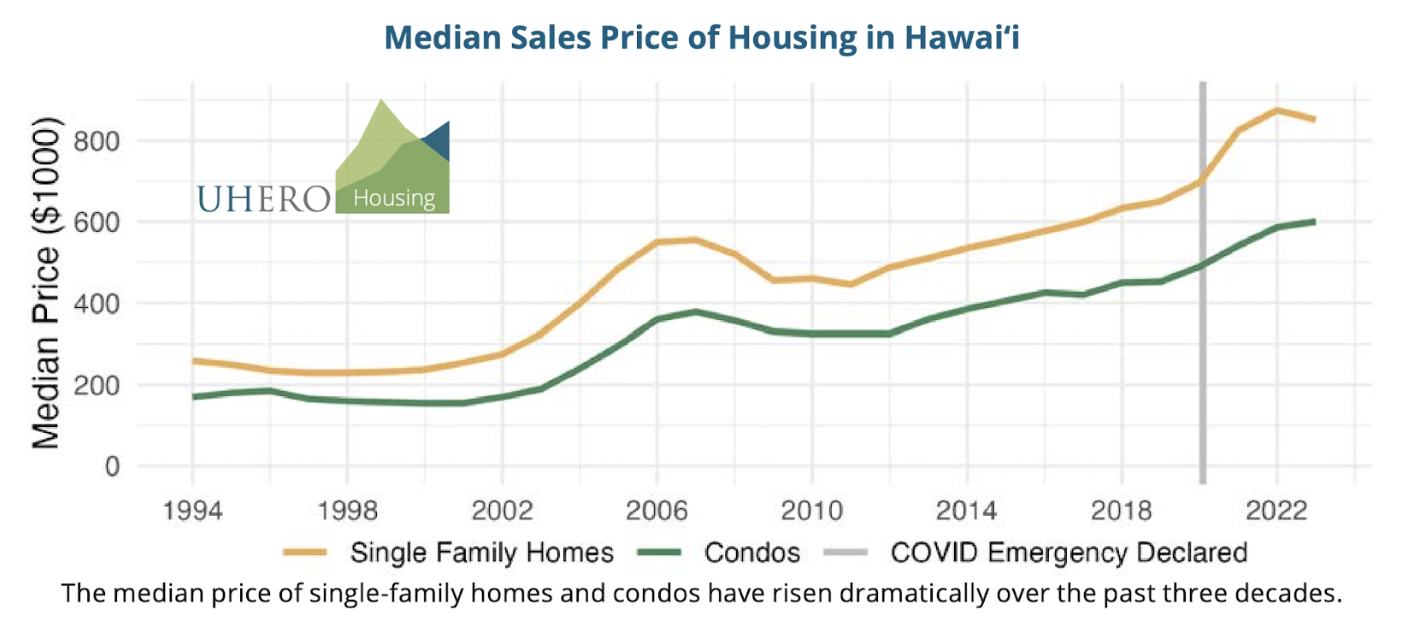
Since the mid-90’s, housing prices have tripled in Hawaii.
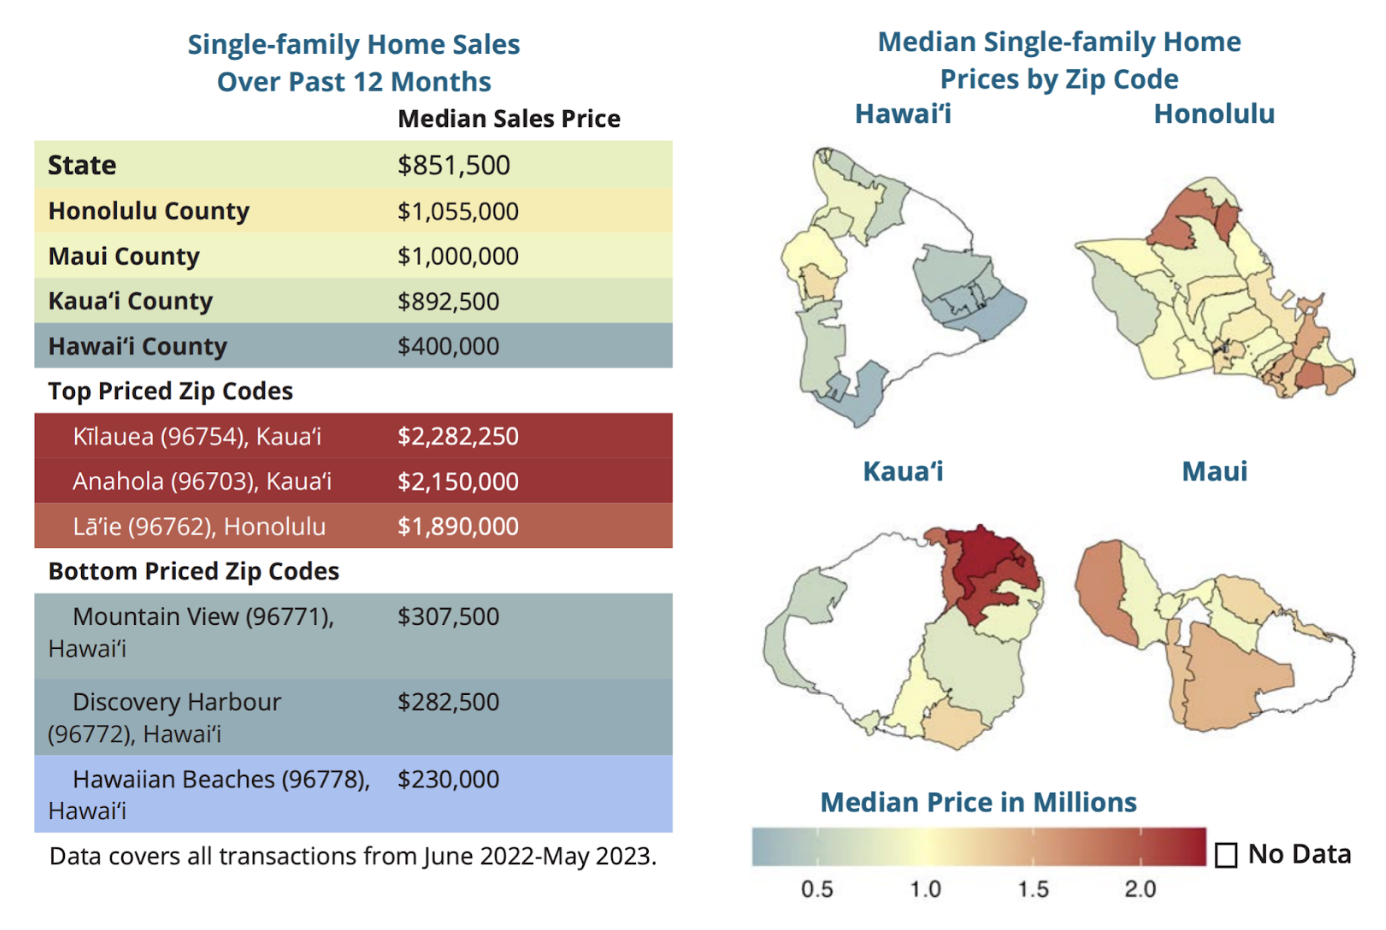
Home prices vary widely across the state. From Hawaiian Beaches at $230K, on the East end of the state, clear to Kaua’i on the West end of the major islands, at $2.3M in Kīlauea.
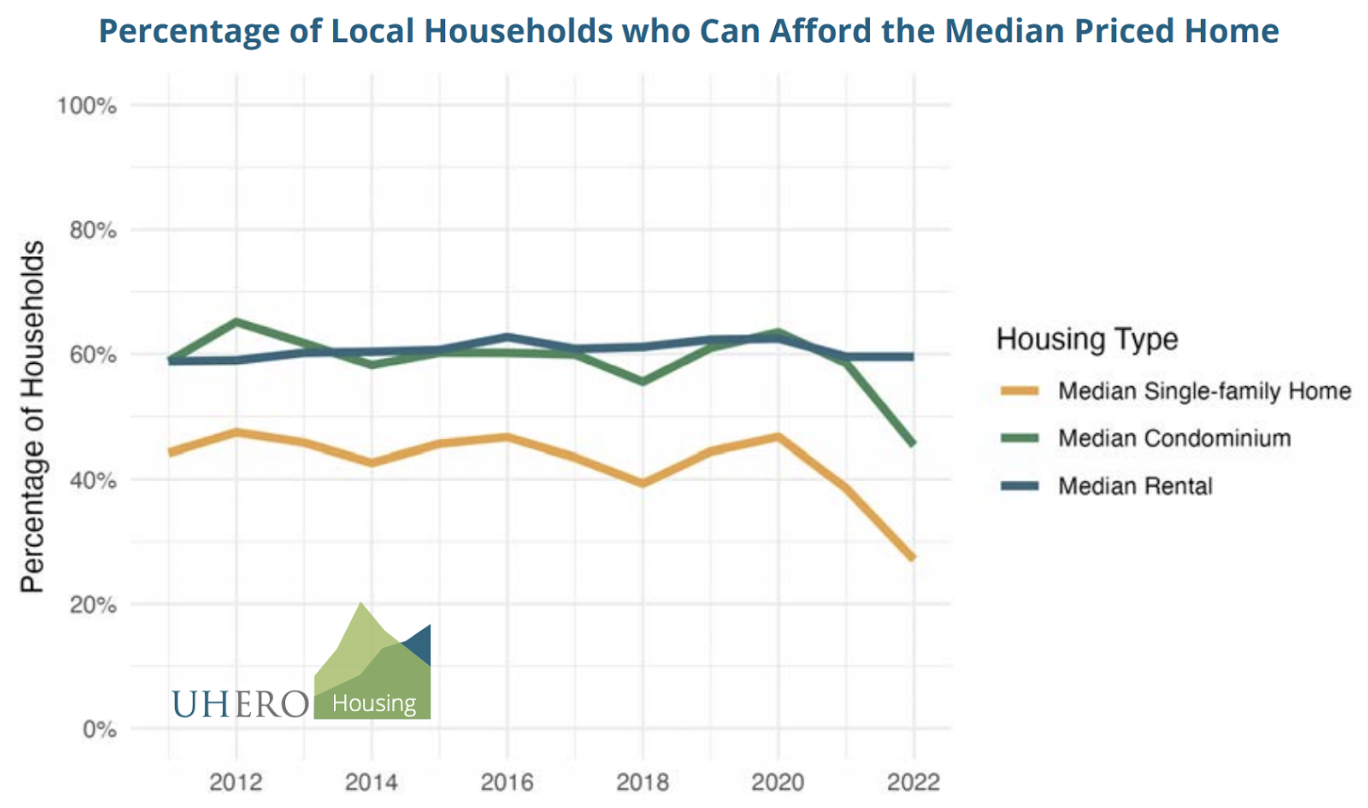
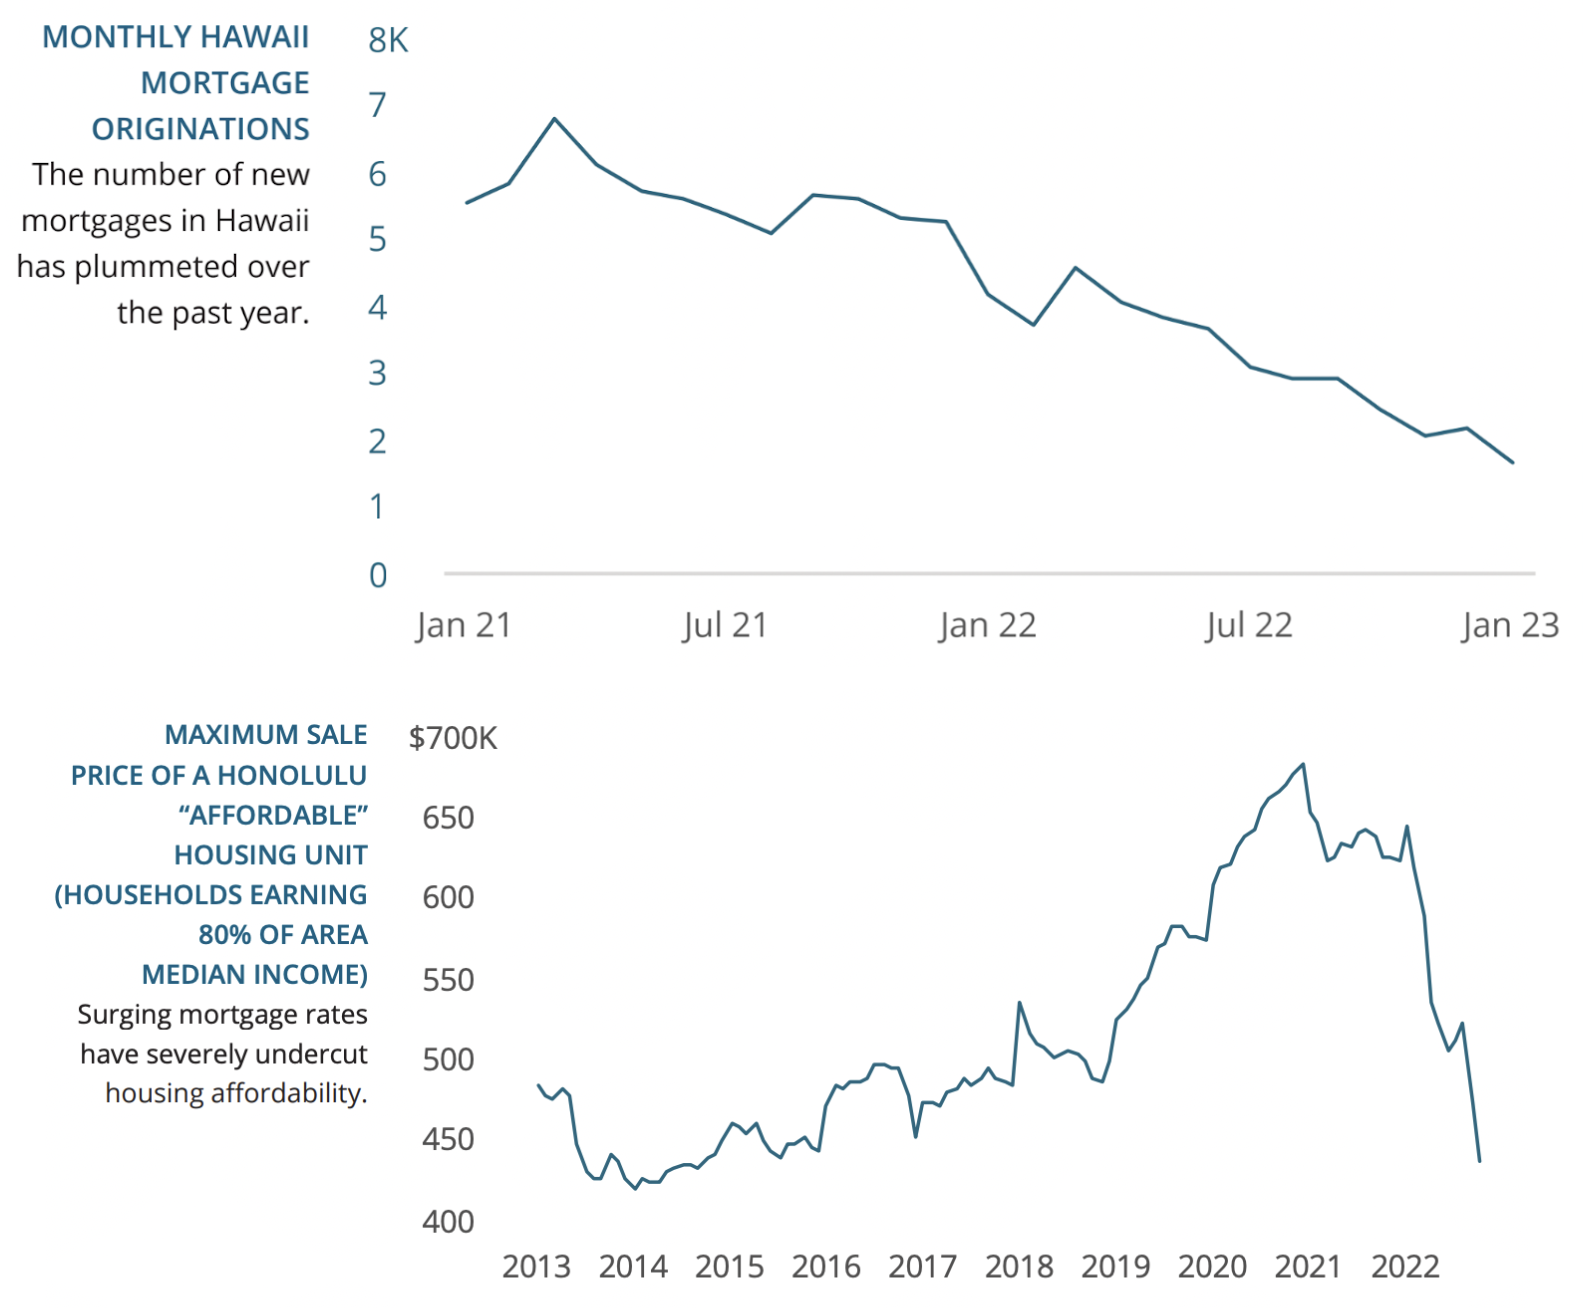
Affordability: Only 33% of local households can afford a mortgage on a median priced single family home.
Source: UHERO
WHO IS BUYING HAWAII REAL ESTATE?
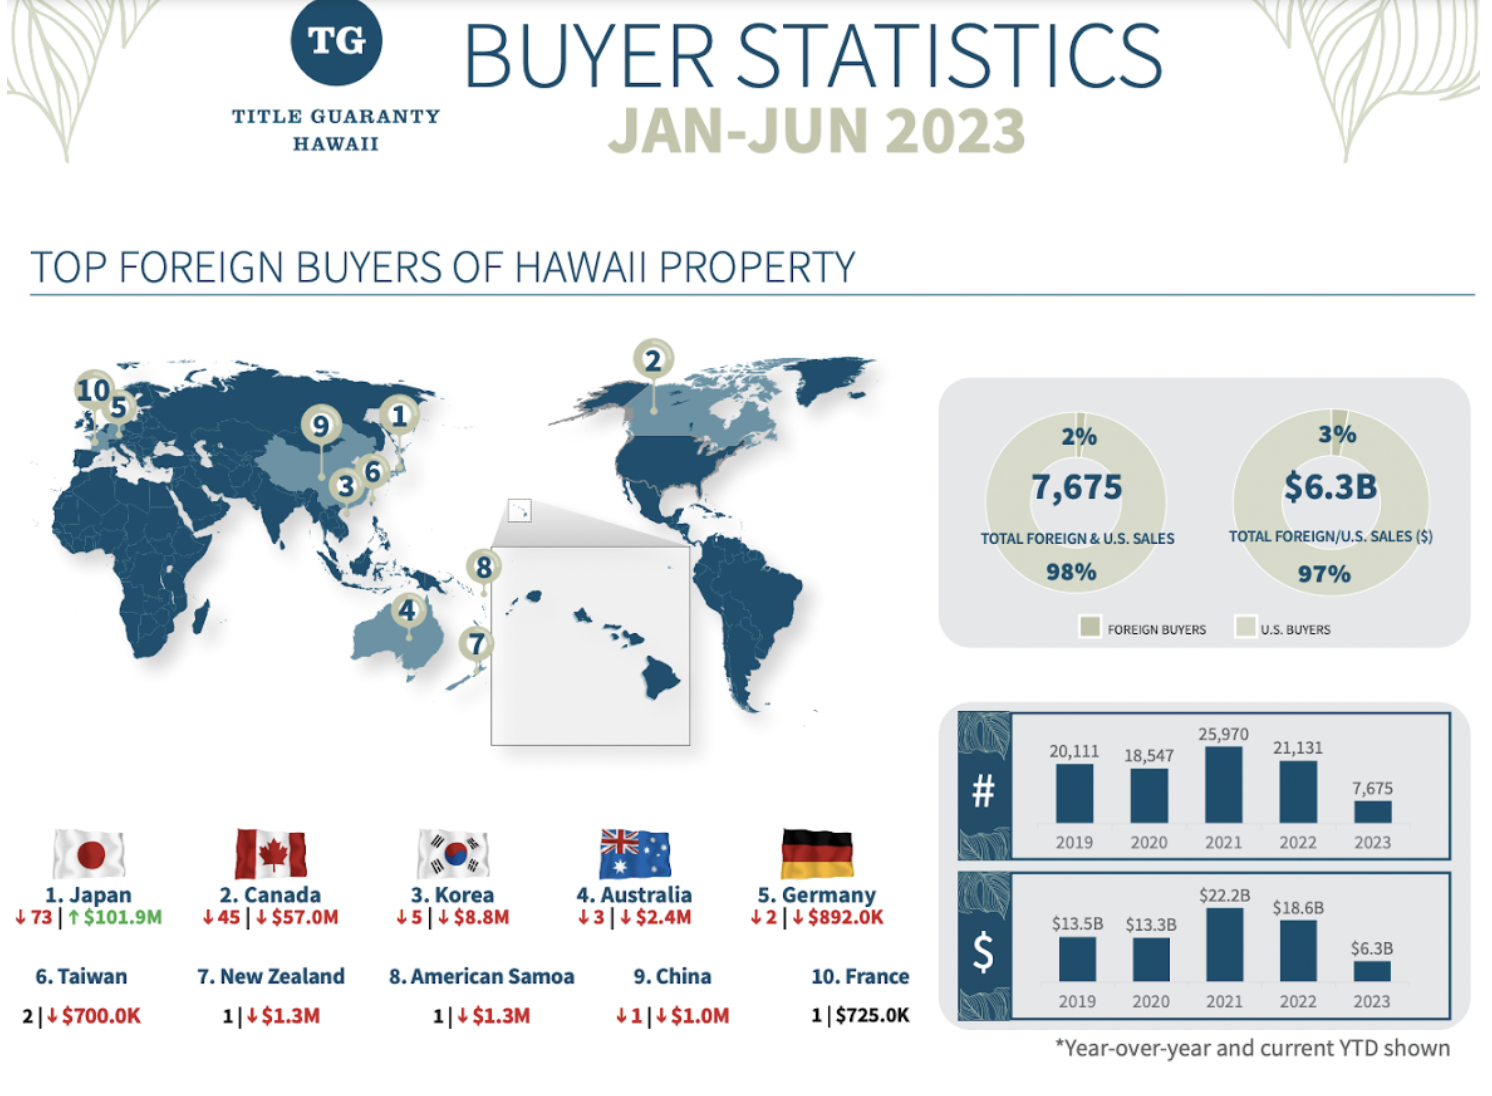
For the entire state of Hawaii, around 7,700, or $6.3B, of real estate transactions occurred in the first two quarters of 2023. Fully 74% of the buyers were Hawaii Residents and 2% were foreign buyers. The next largest group of buyers were from California, at ~10%. Japan was the top foreign buyer, totaling almost $102M over 73 sales (Title Guaranty Hawaii).
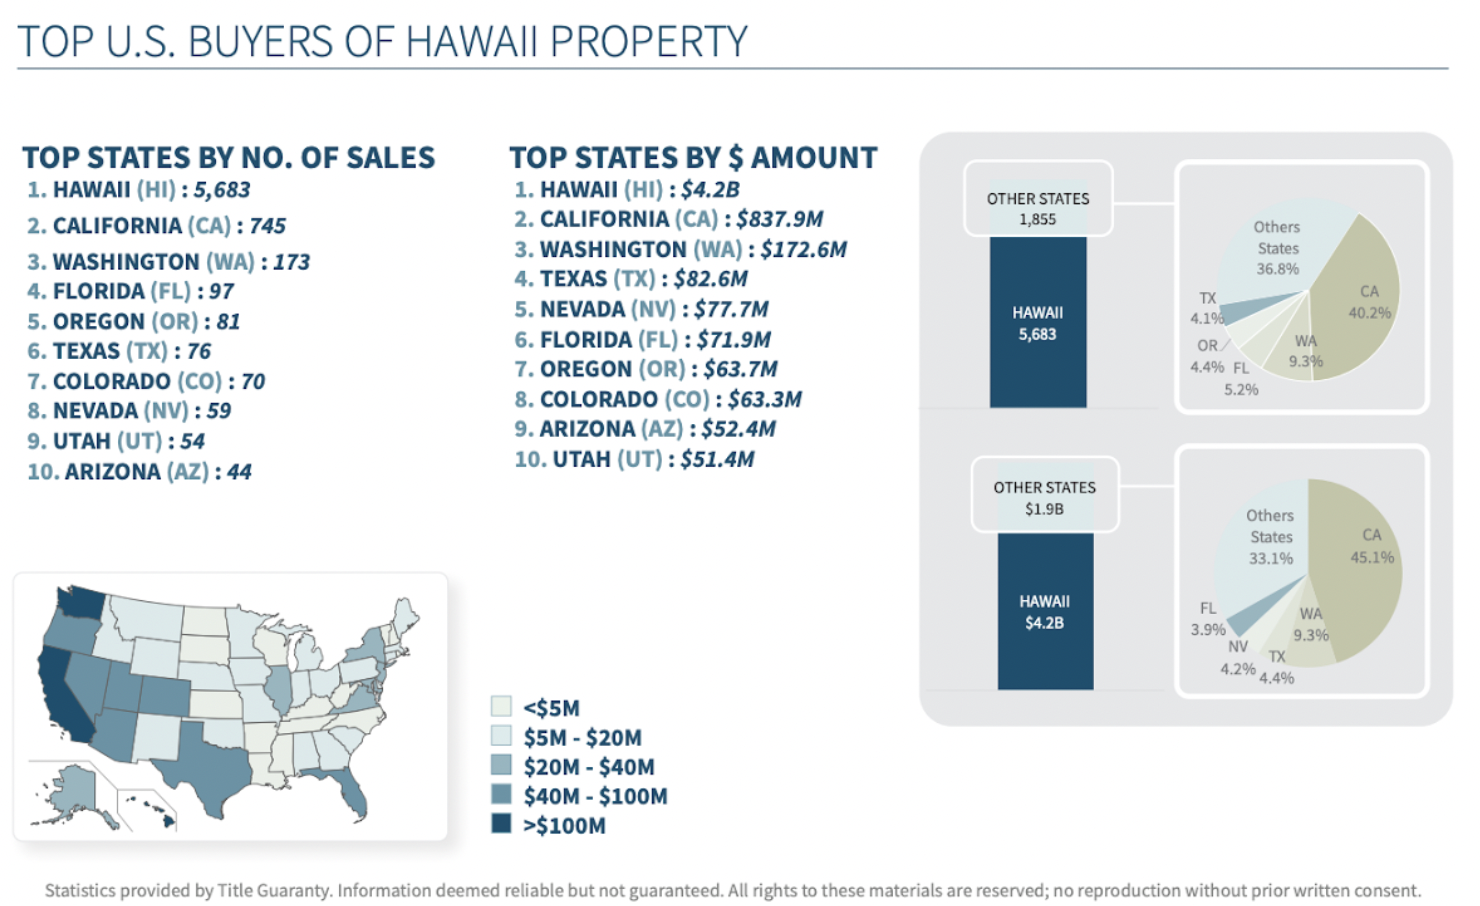
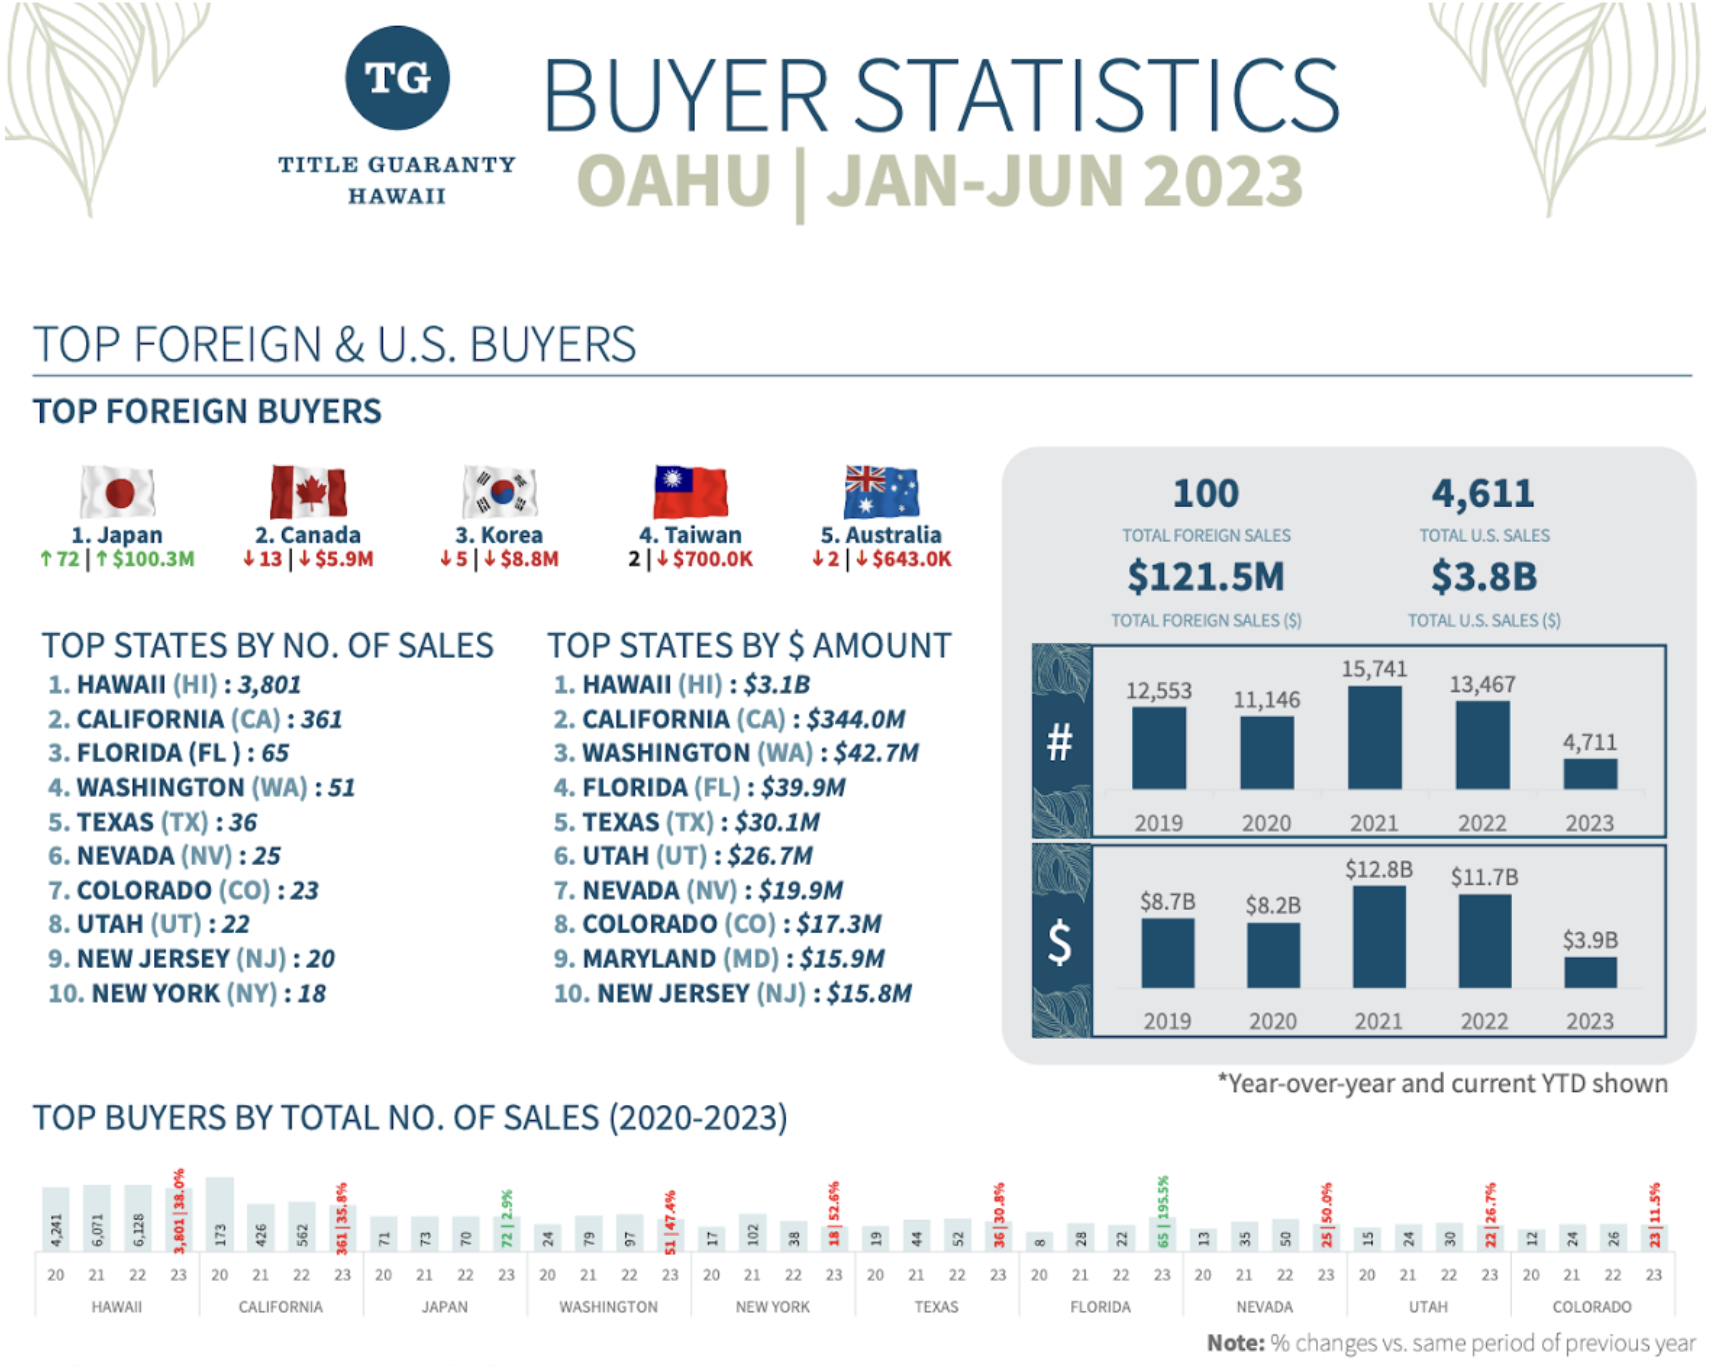
Oahu represents about 62% of the real estate sales & dollar volume in the state. On Oahu, fully 81% of the transactions were Hawaii resident buyers. The next largest total of purchases came from California, at ~8%. Japan is by far the number one foreign investor on Oahu. All but one of the 73 Japanese purchases in Hawaii were on Oahu.
PRICE GROWTH
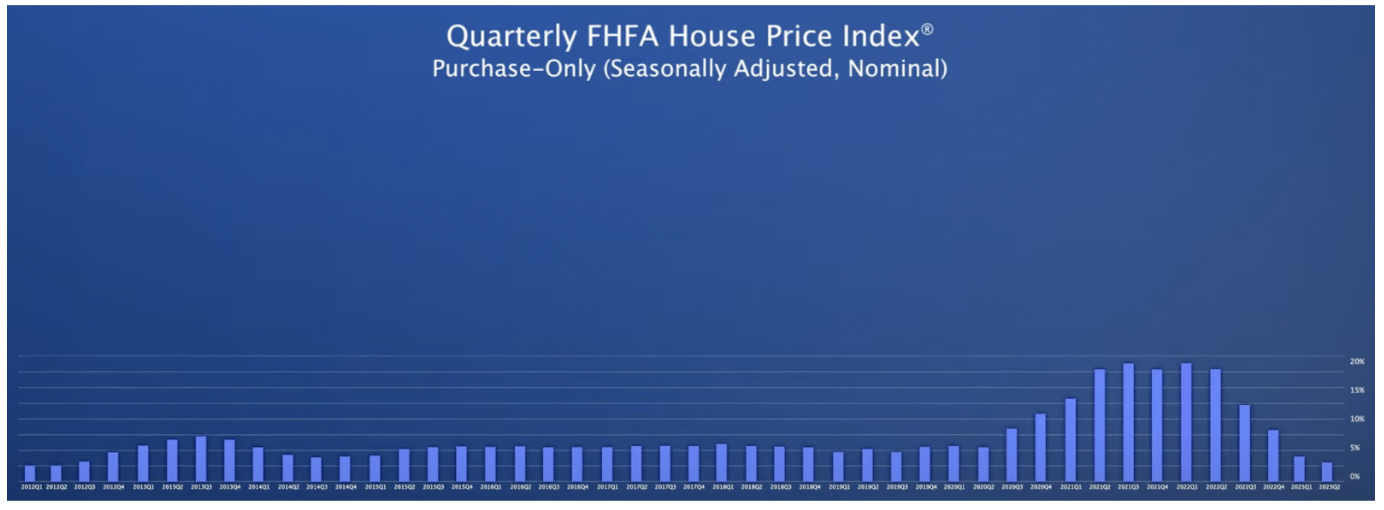
In Q3, the rapid deceleration in price growth reversed the trend. Despite higher interest rates, average housing prices remain stable due partially to historically low housing supply. We had an average price appreciation of 5.5%. We can see on the chart below, that the last four quarters were the first time that we did not have double digit growth since 2020Q3. The rate of price growth hovered around 20% for 5 consecutive quarters. (FHFA.gov)
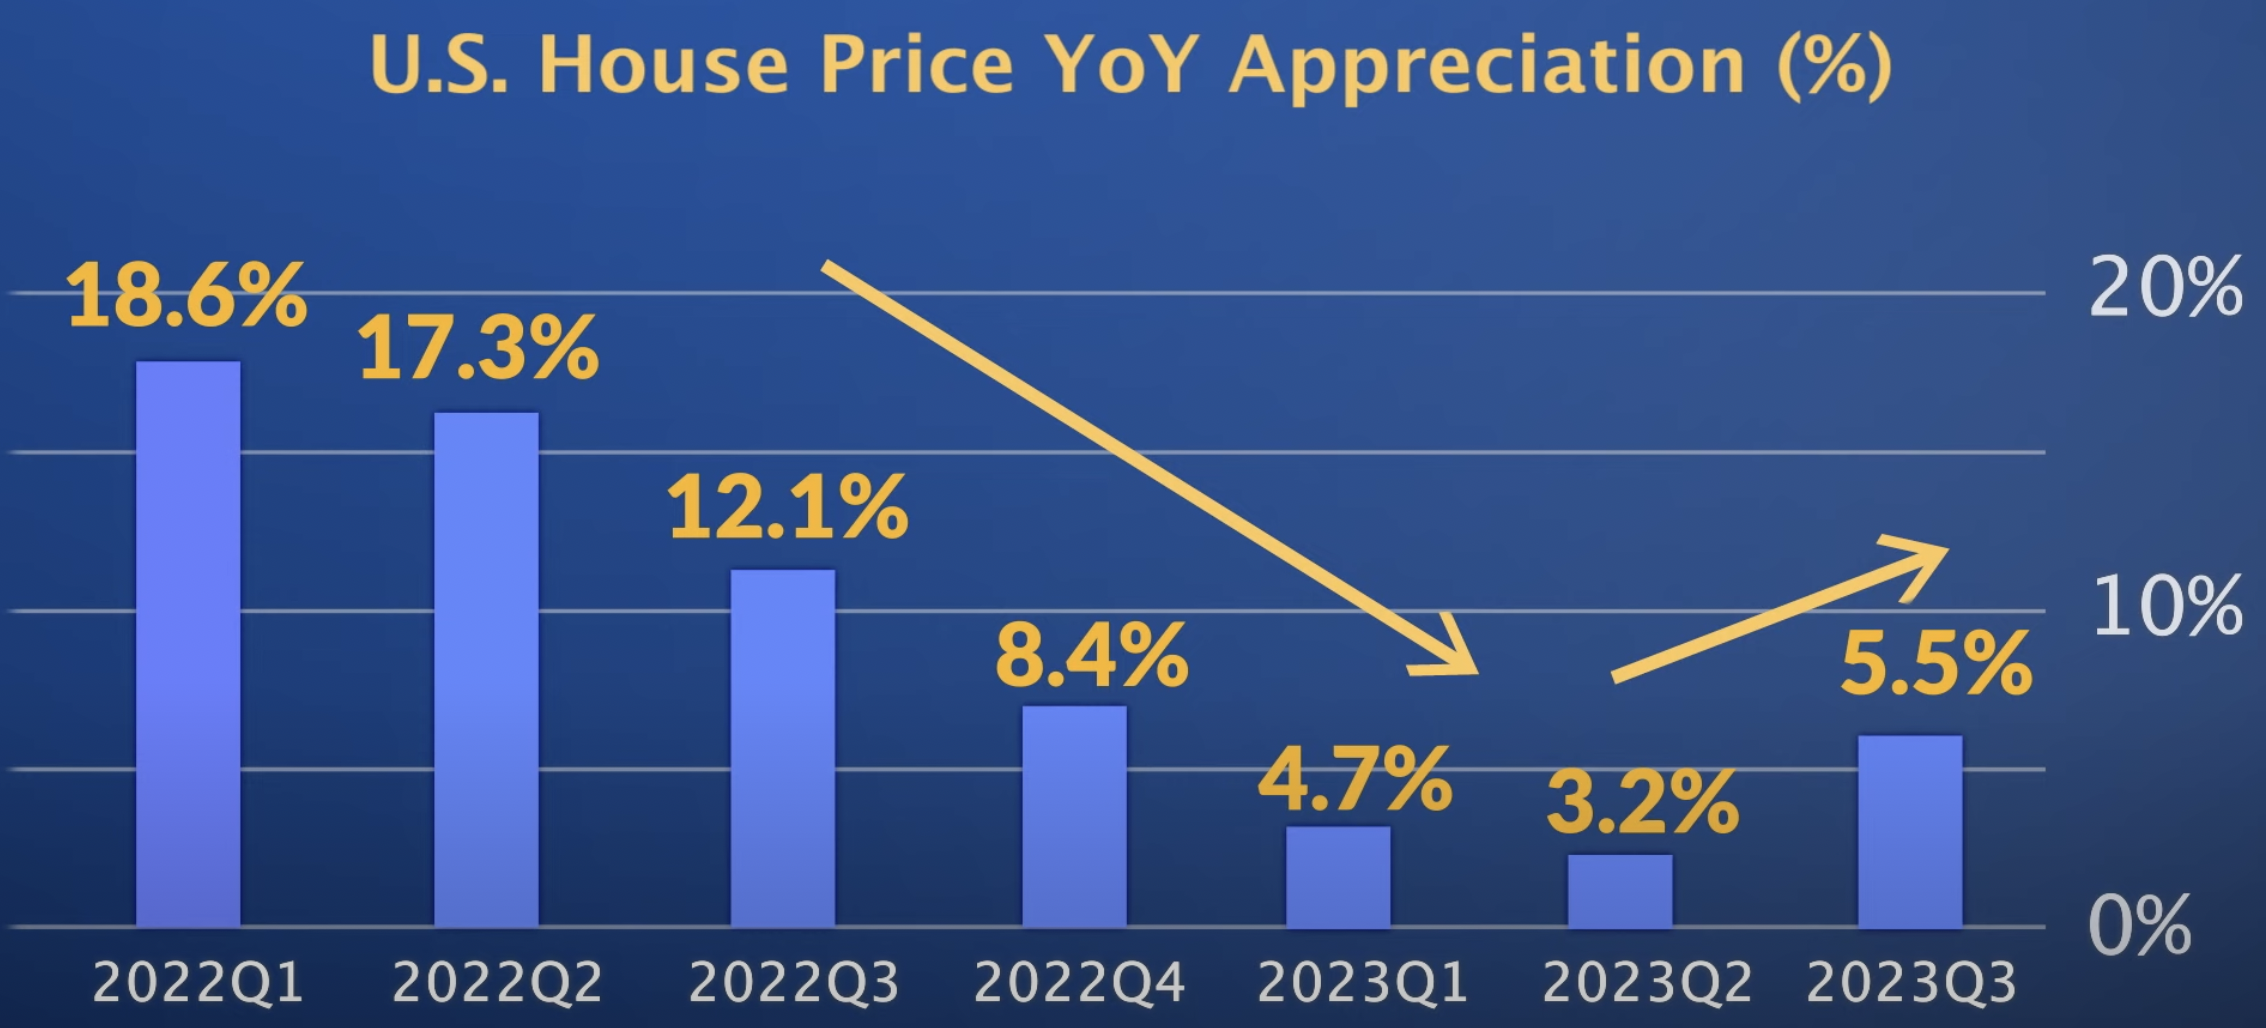
The 3rd quarter of 2023, marked the 47th straight quarter of price growth appreciation, since 2012.
Source: FHFA.gov
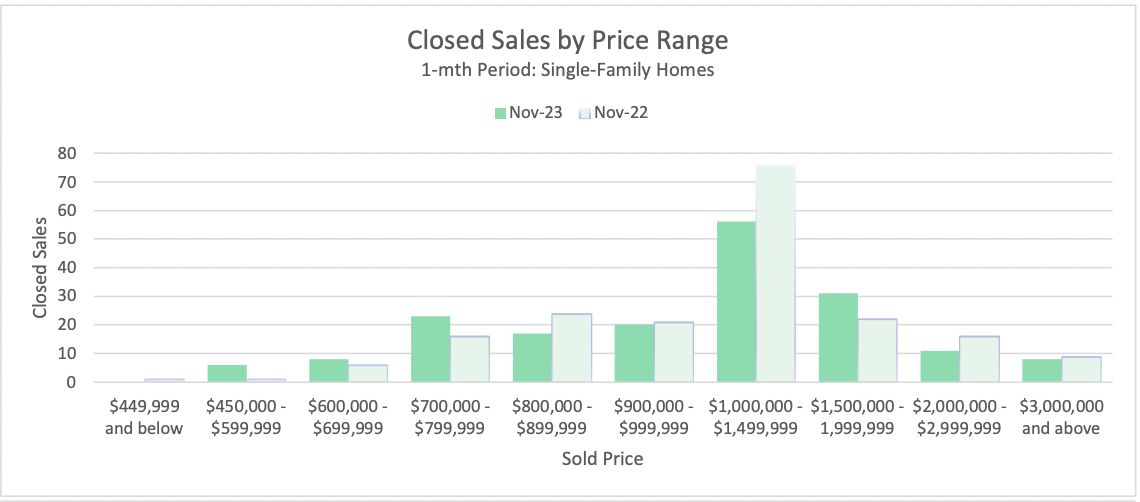
PRICE POINTS
For single family homes, we see a sweet spot from $1-1.5M, where the largest amount of closings are occurring.
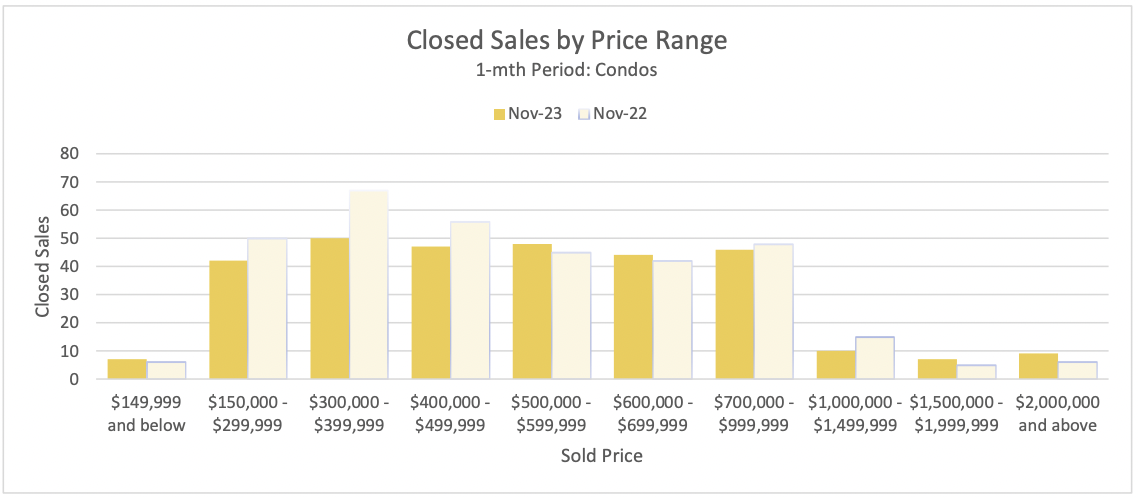
For condominiums (yellow chart), we can see the price point sweet spot in the $300-399k range.
INTEREST RATES
Interest rates hit a 50 year low in January 2021, of 2.65%. Almost 3 years later, interest rates are more than two and half times higher, to 7.03% (Dec 7, 2023). Highest rates since 2001.
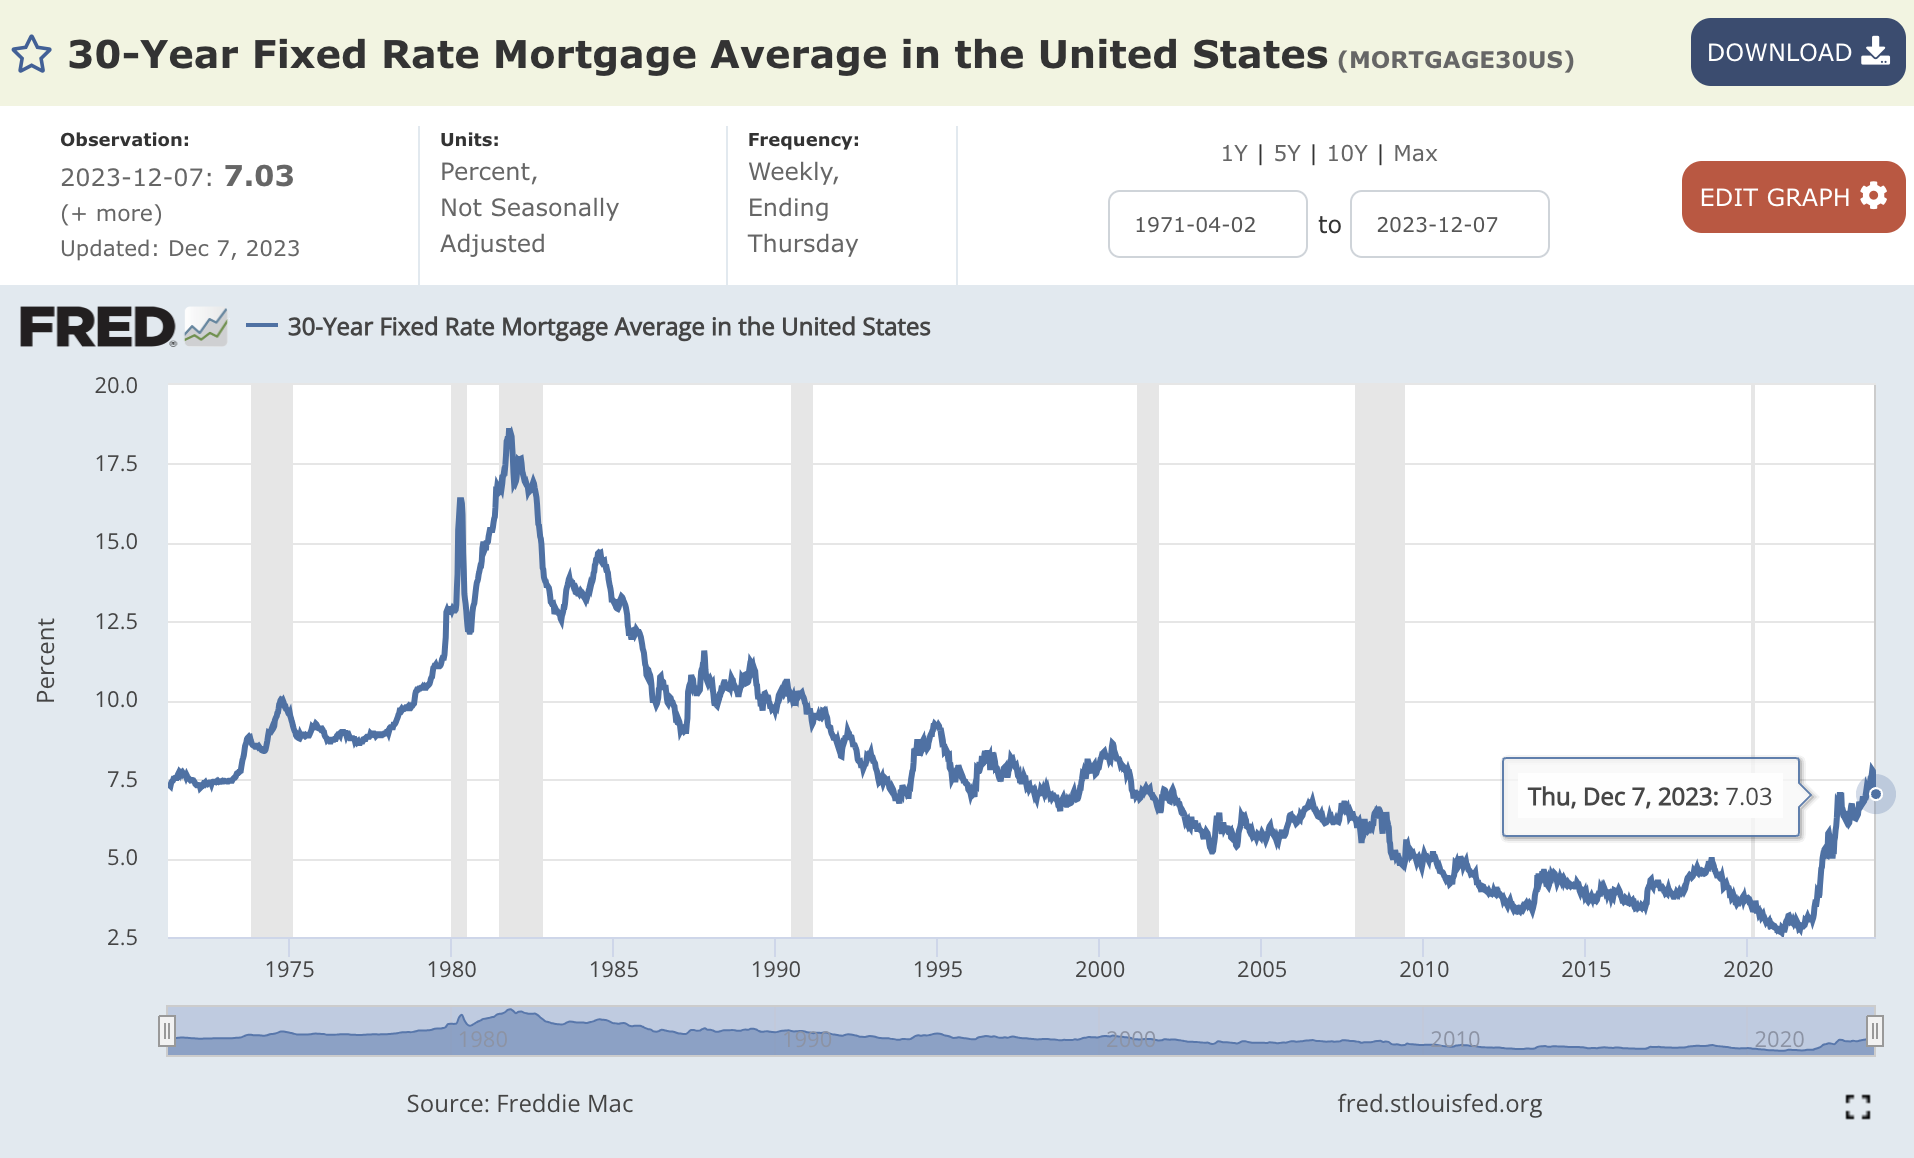
This sharp increase in interest rates, has translated into buyer’s purchasing power & loan originations to go off a cliff (Source: UHERO).
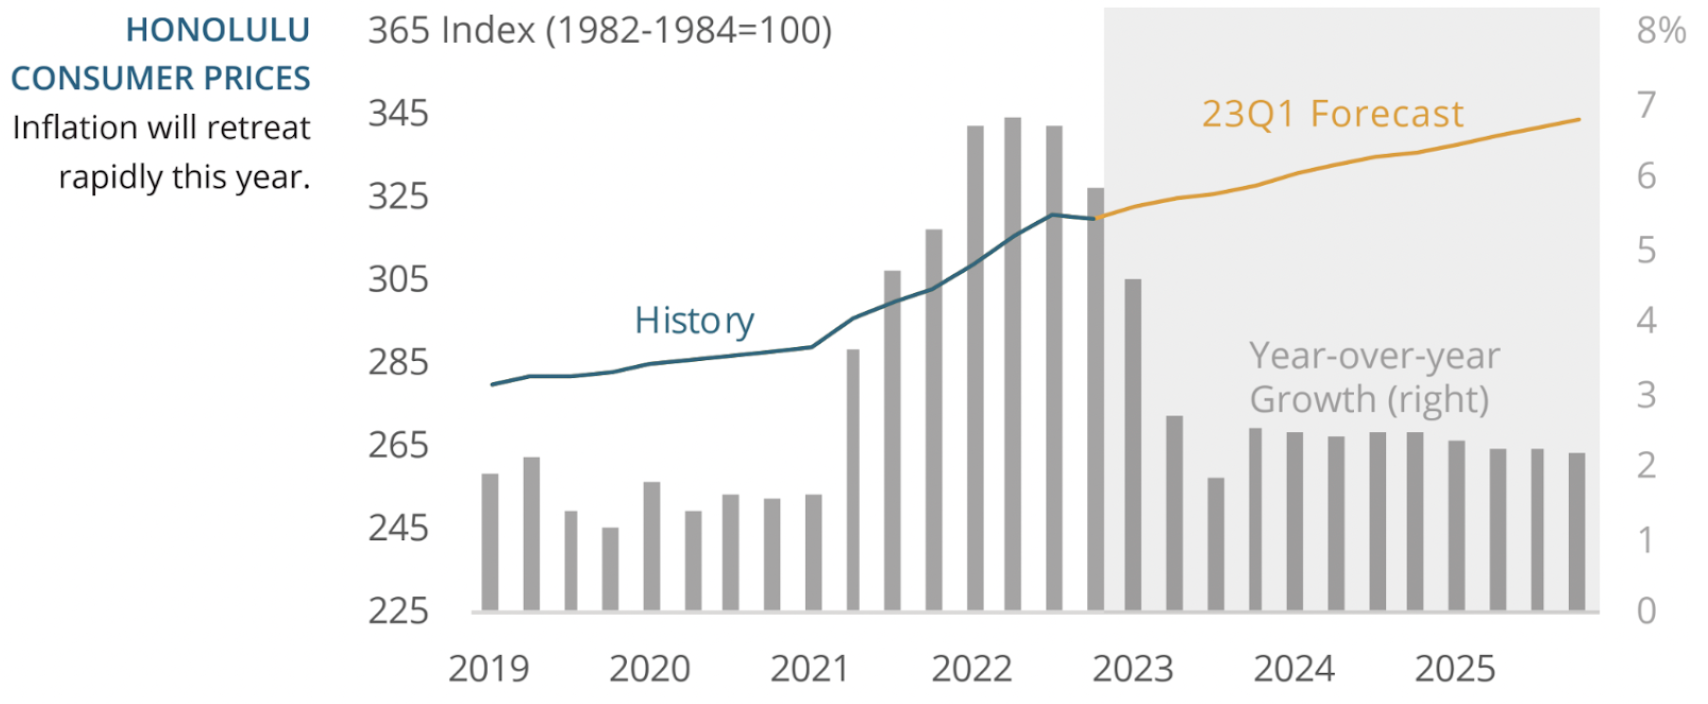
INFLATION
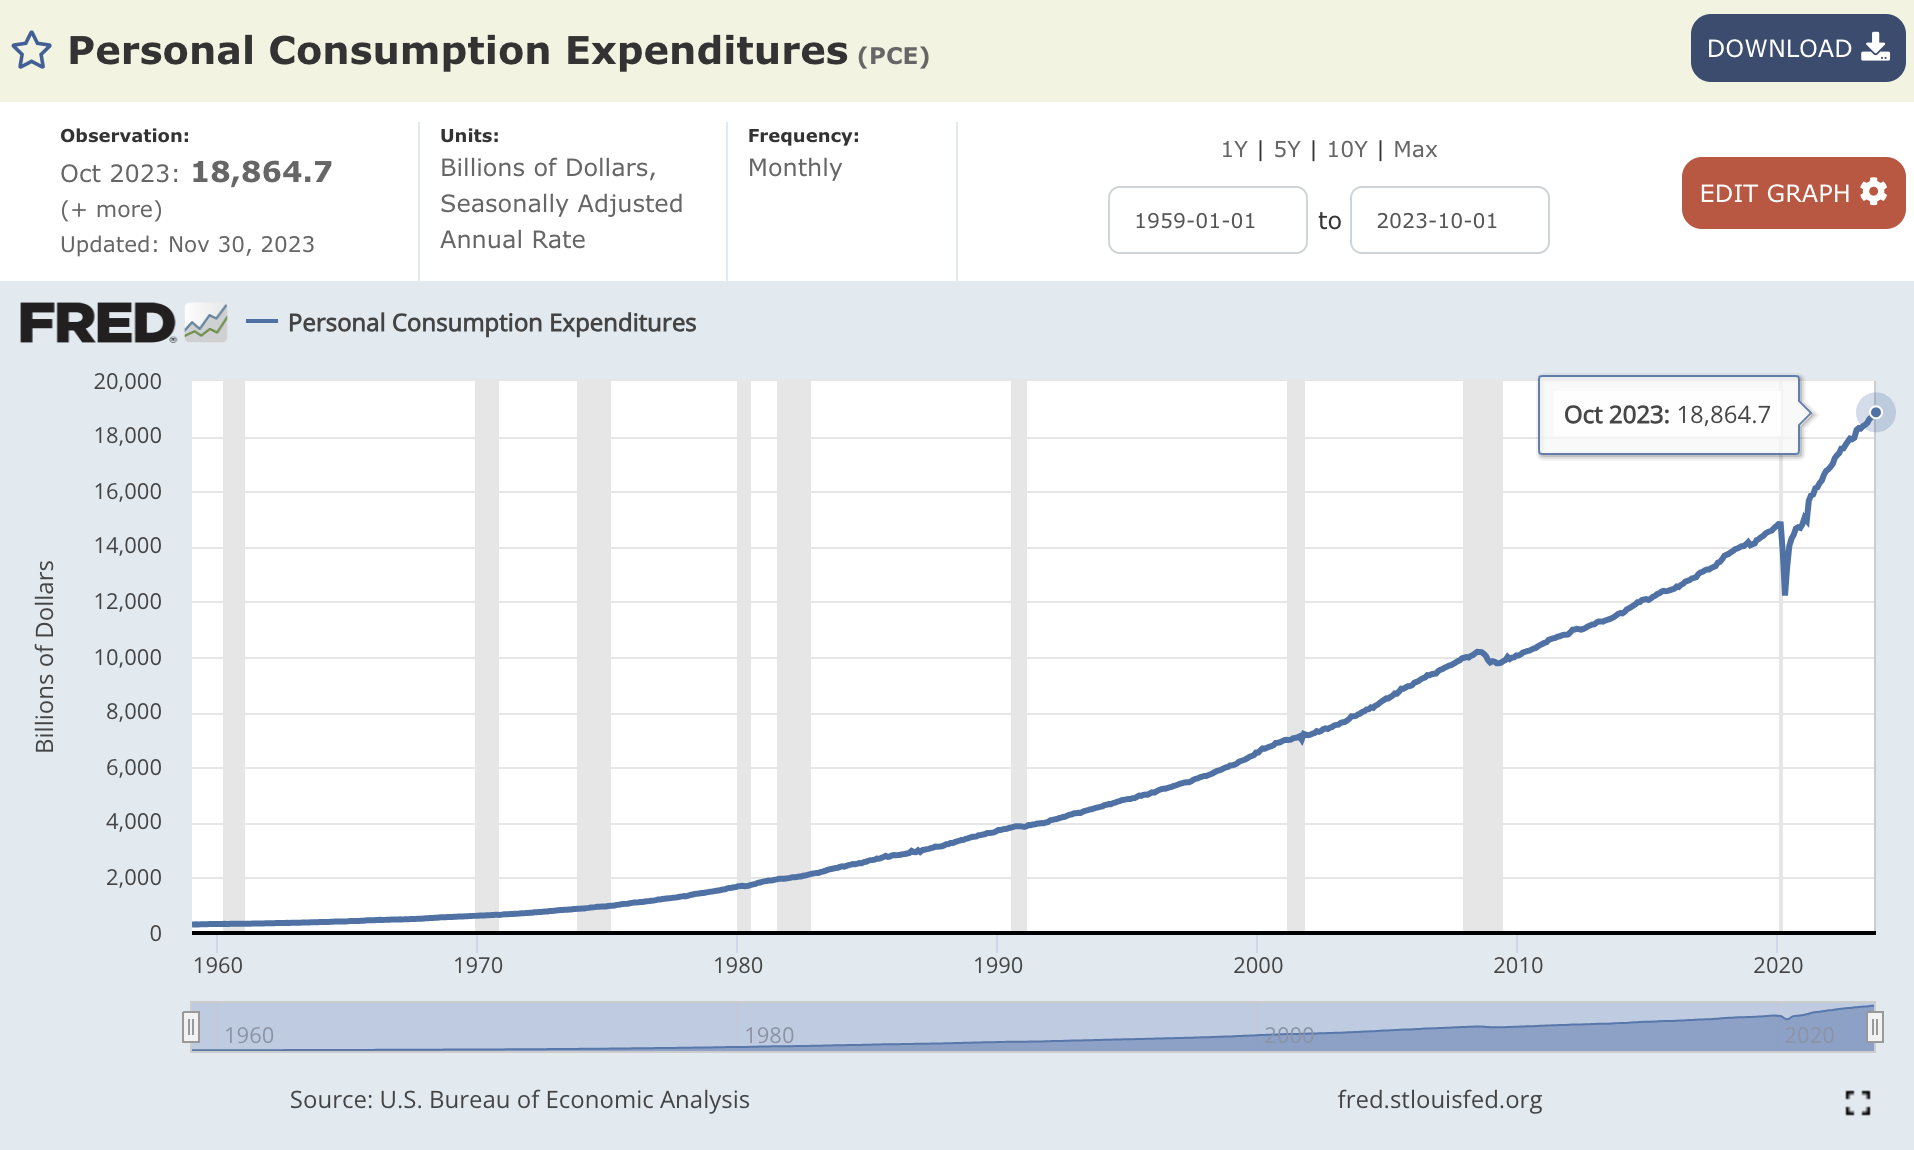
The rising cost of money is a result of the FED trying to tame inflation. In theory, increased interest rates → reduces borrowing → reduces spending → reduces demand for workers → reduces pressure on wages → reduces pressure on INFLATION. Personal Consumption Expenditures are up 33%, since the onset of Covid.
Consumer prices index is up 12% since COVID.
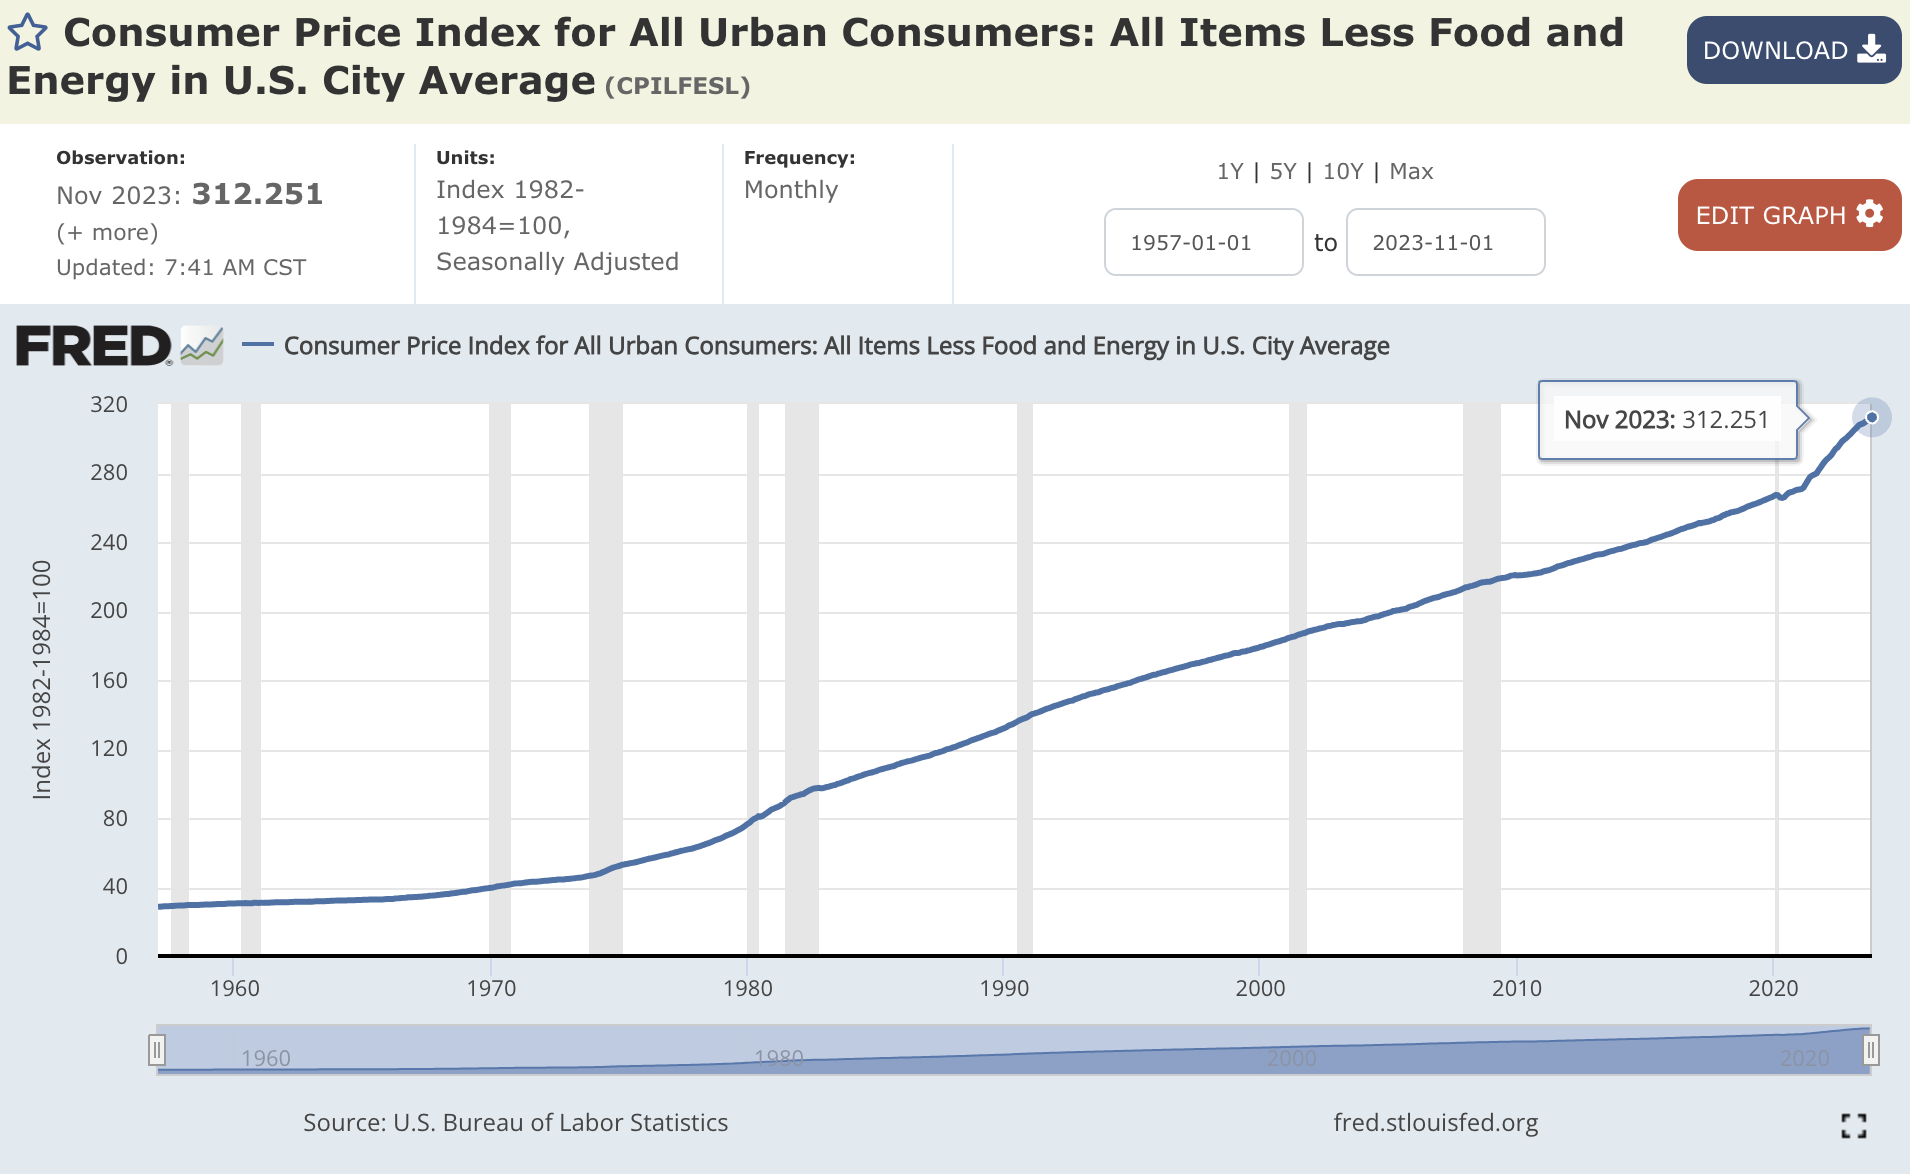
Owning real estate is a good hedge against inflation.
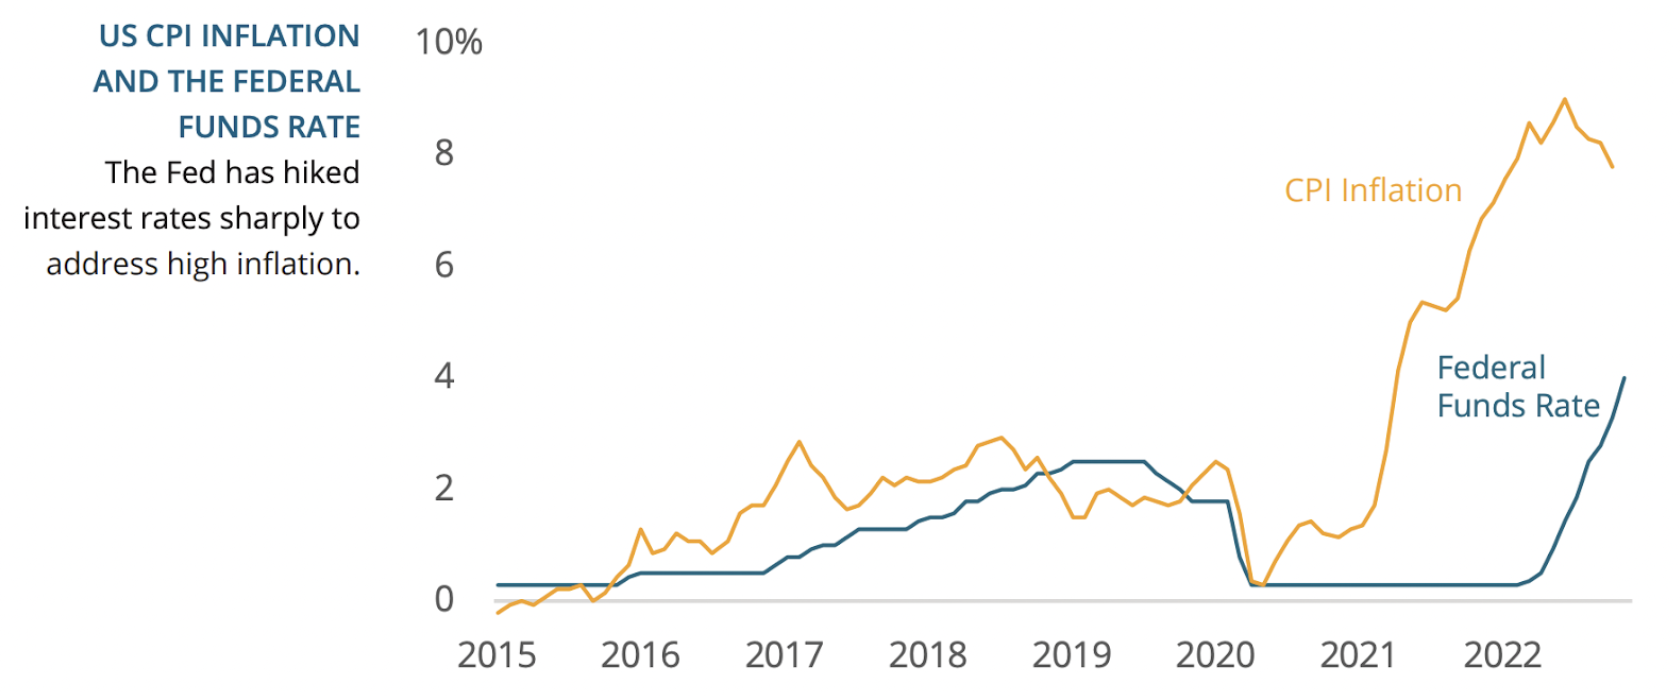
CPI peaked over 9% in the Summer of 2022. UHERO says, “Mild US recession in 2023, maybe slipping into 2024 and Hawaii will avoid that..”
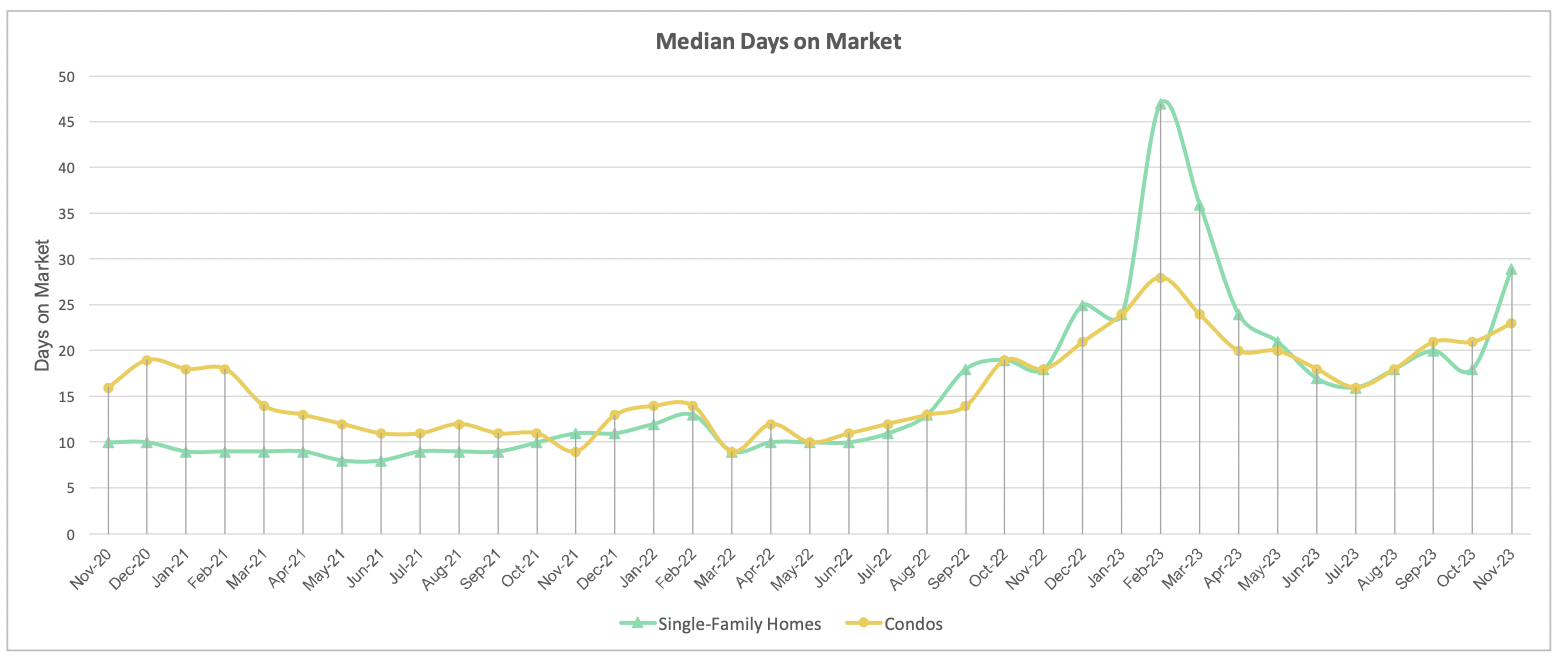
DAYS ON MARKET (Velocity)
Days on market is a good measure of “market velocity” or how quickly homes are selling. In November, market velocity for single family homes was 29 days and condominiums was 23 days. A 61% market velocity decrease for single family and 28% decrease for condos, YOY.
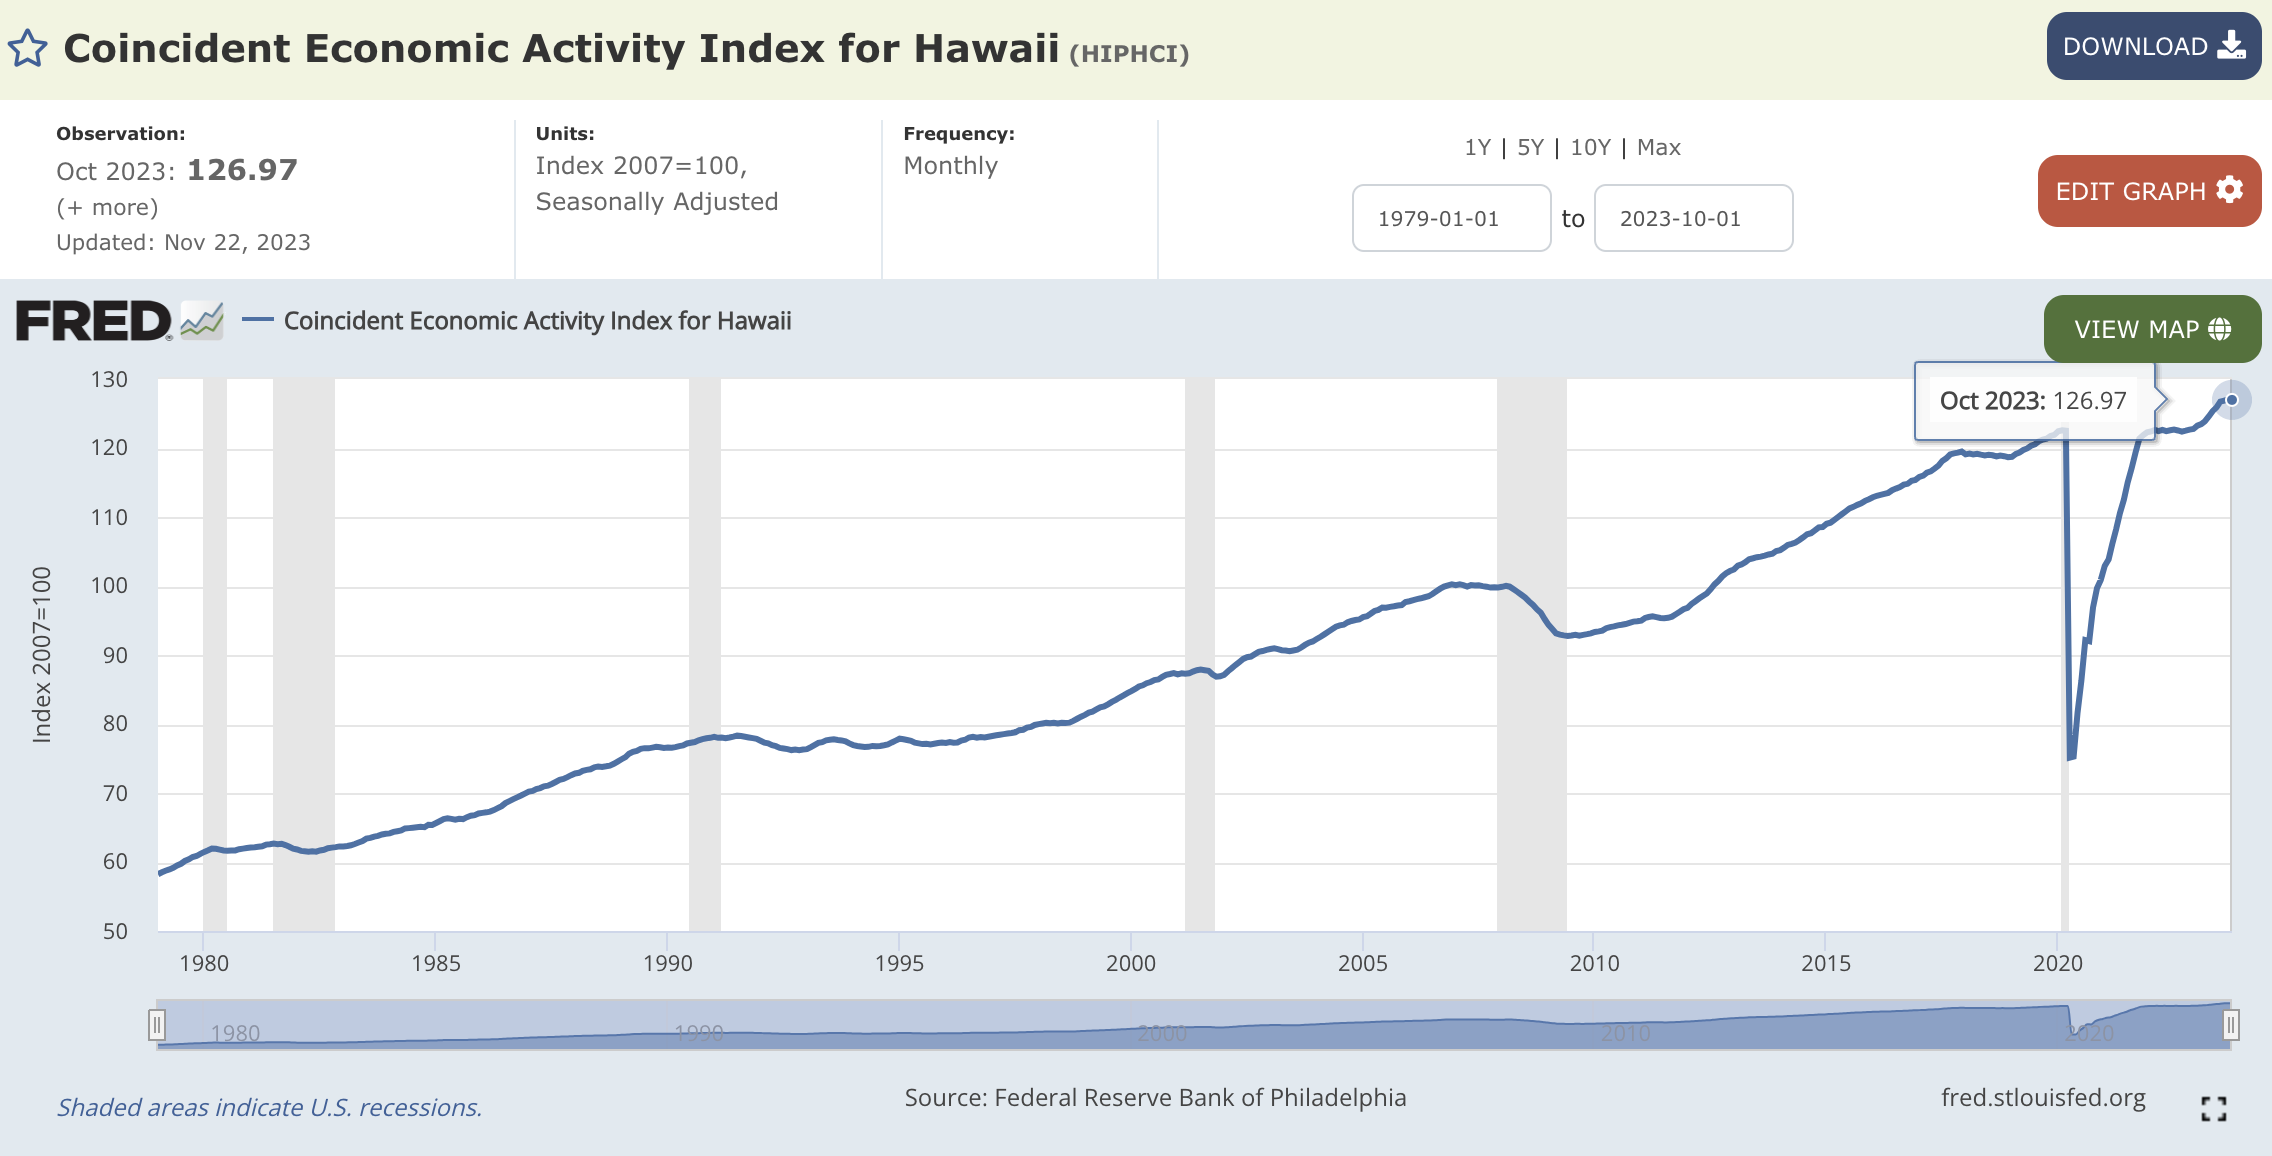
ECONOMIC ACTIVITY
The line in the graph represents an index that tracks Hawaii’s economic activity. We can see the last 6 US recessions highlighted in gray. Since November of 2019, the index dropped 39%. In October 2022 (124 pts), we finally eclipsed our previous Pre-Covid, all time highs (123 pts). In October, we are at about 127 pts.
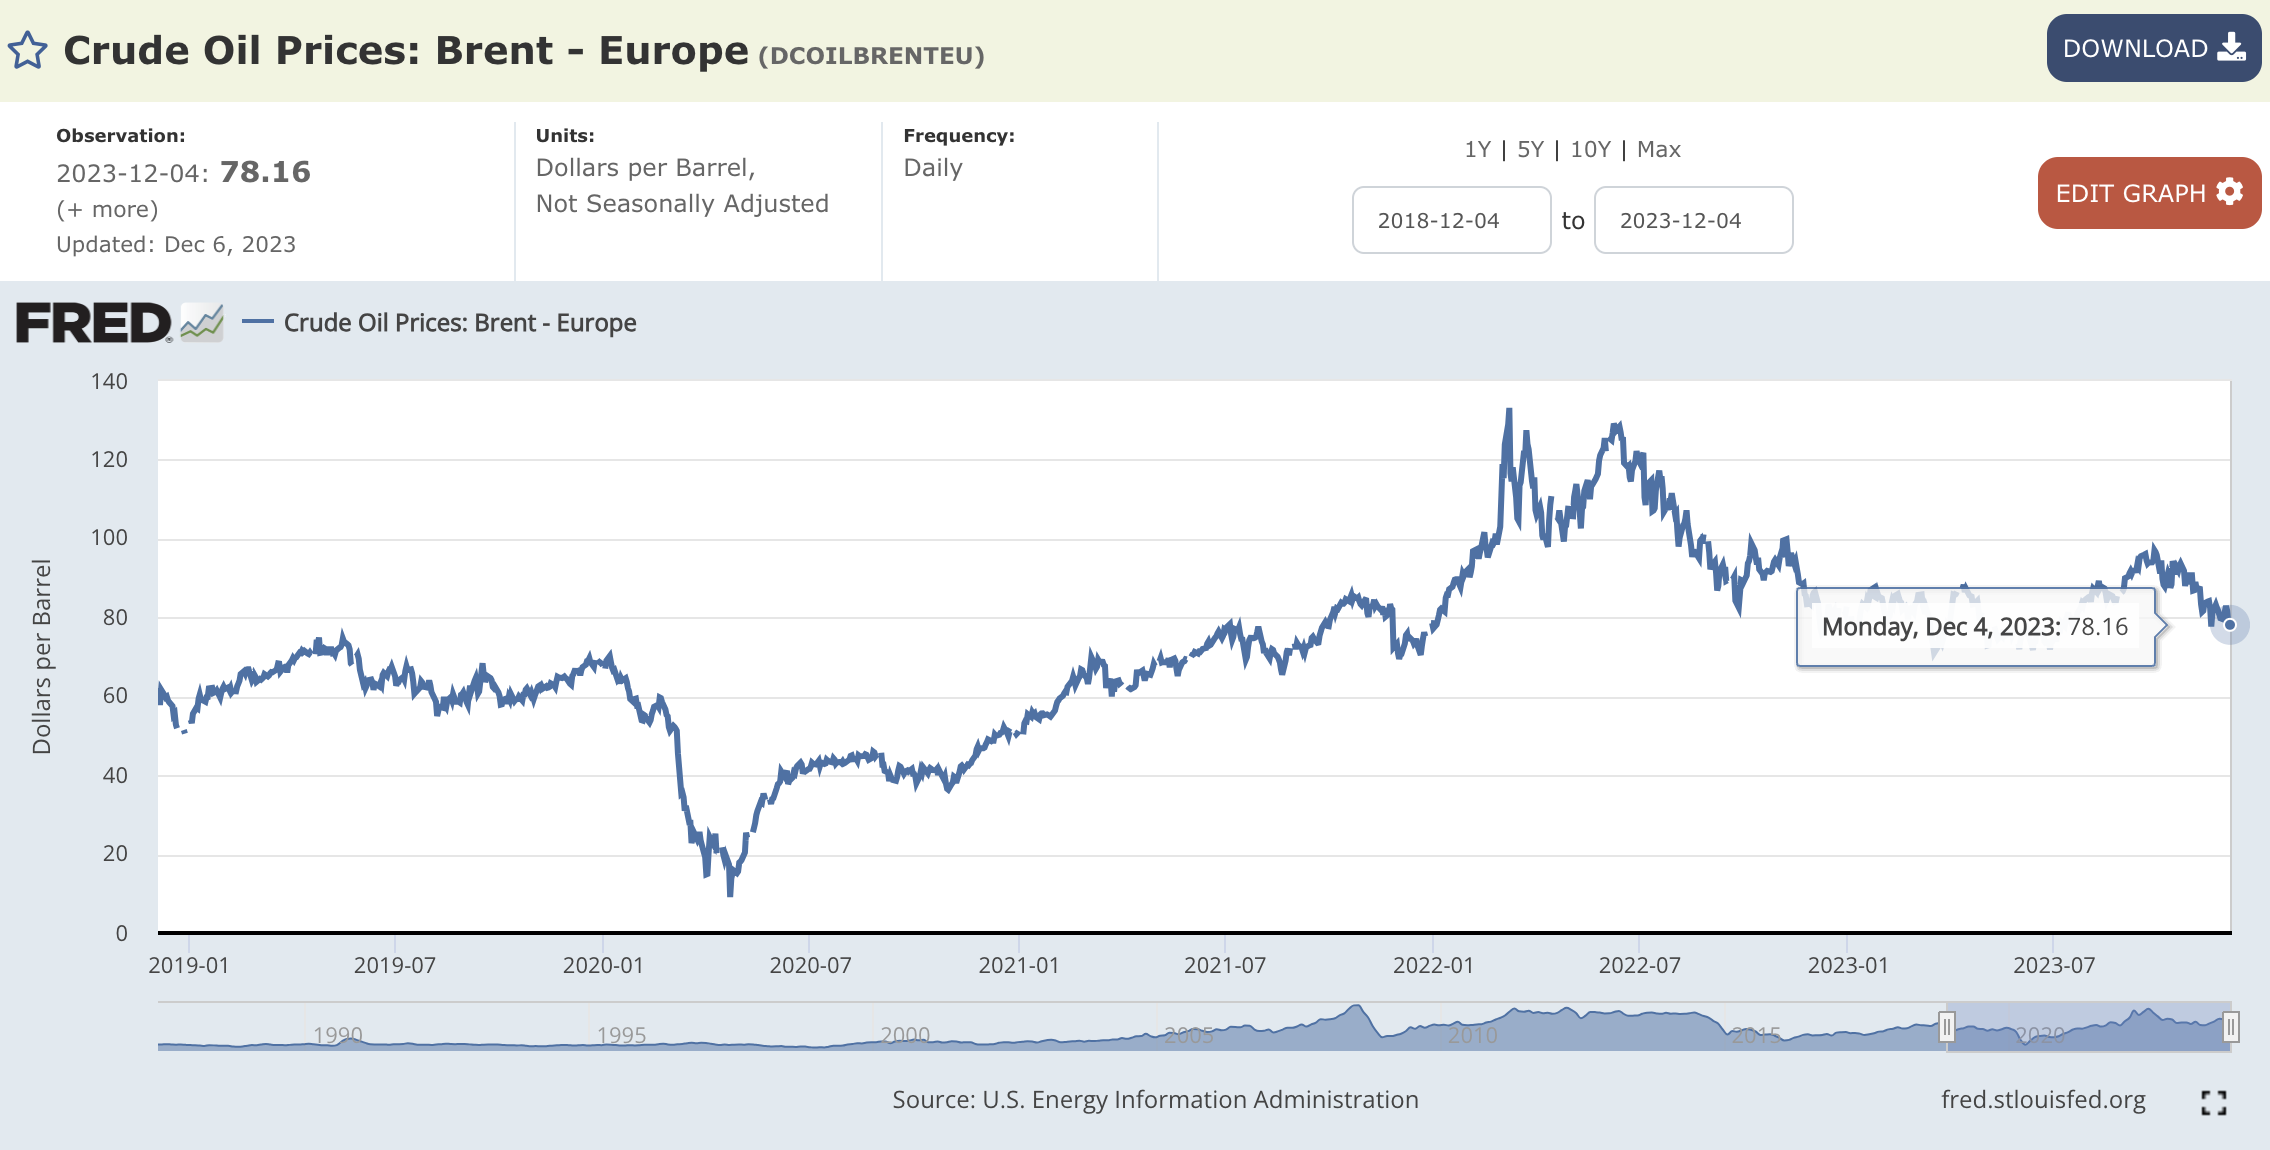
CRUDE OIL Expenses
The price of oil has returned below the prices it jumped up to following the Russian invasion of Ukraine on 2/24/2022.
VISITOR Spending, Days & Arrivals
Visitor expenditures were ~18% higher than the same period, 2019.
Visitor Days are down ~4% of pre Covid numbers.
Visitor Arrivals are ~7% lower than pre Covid.
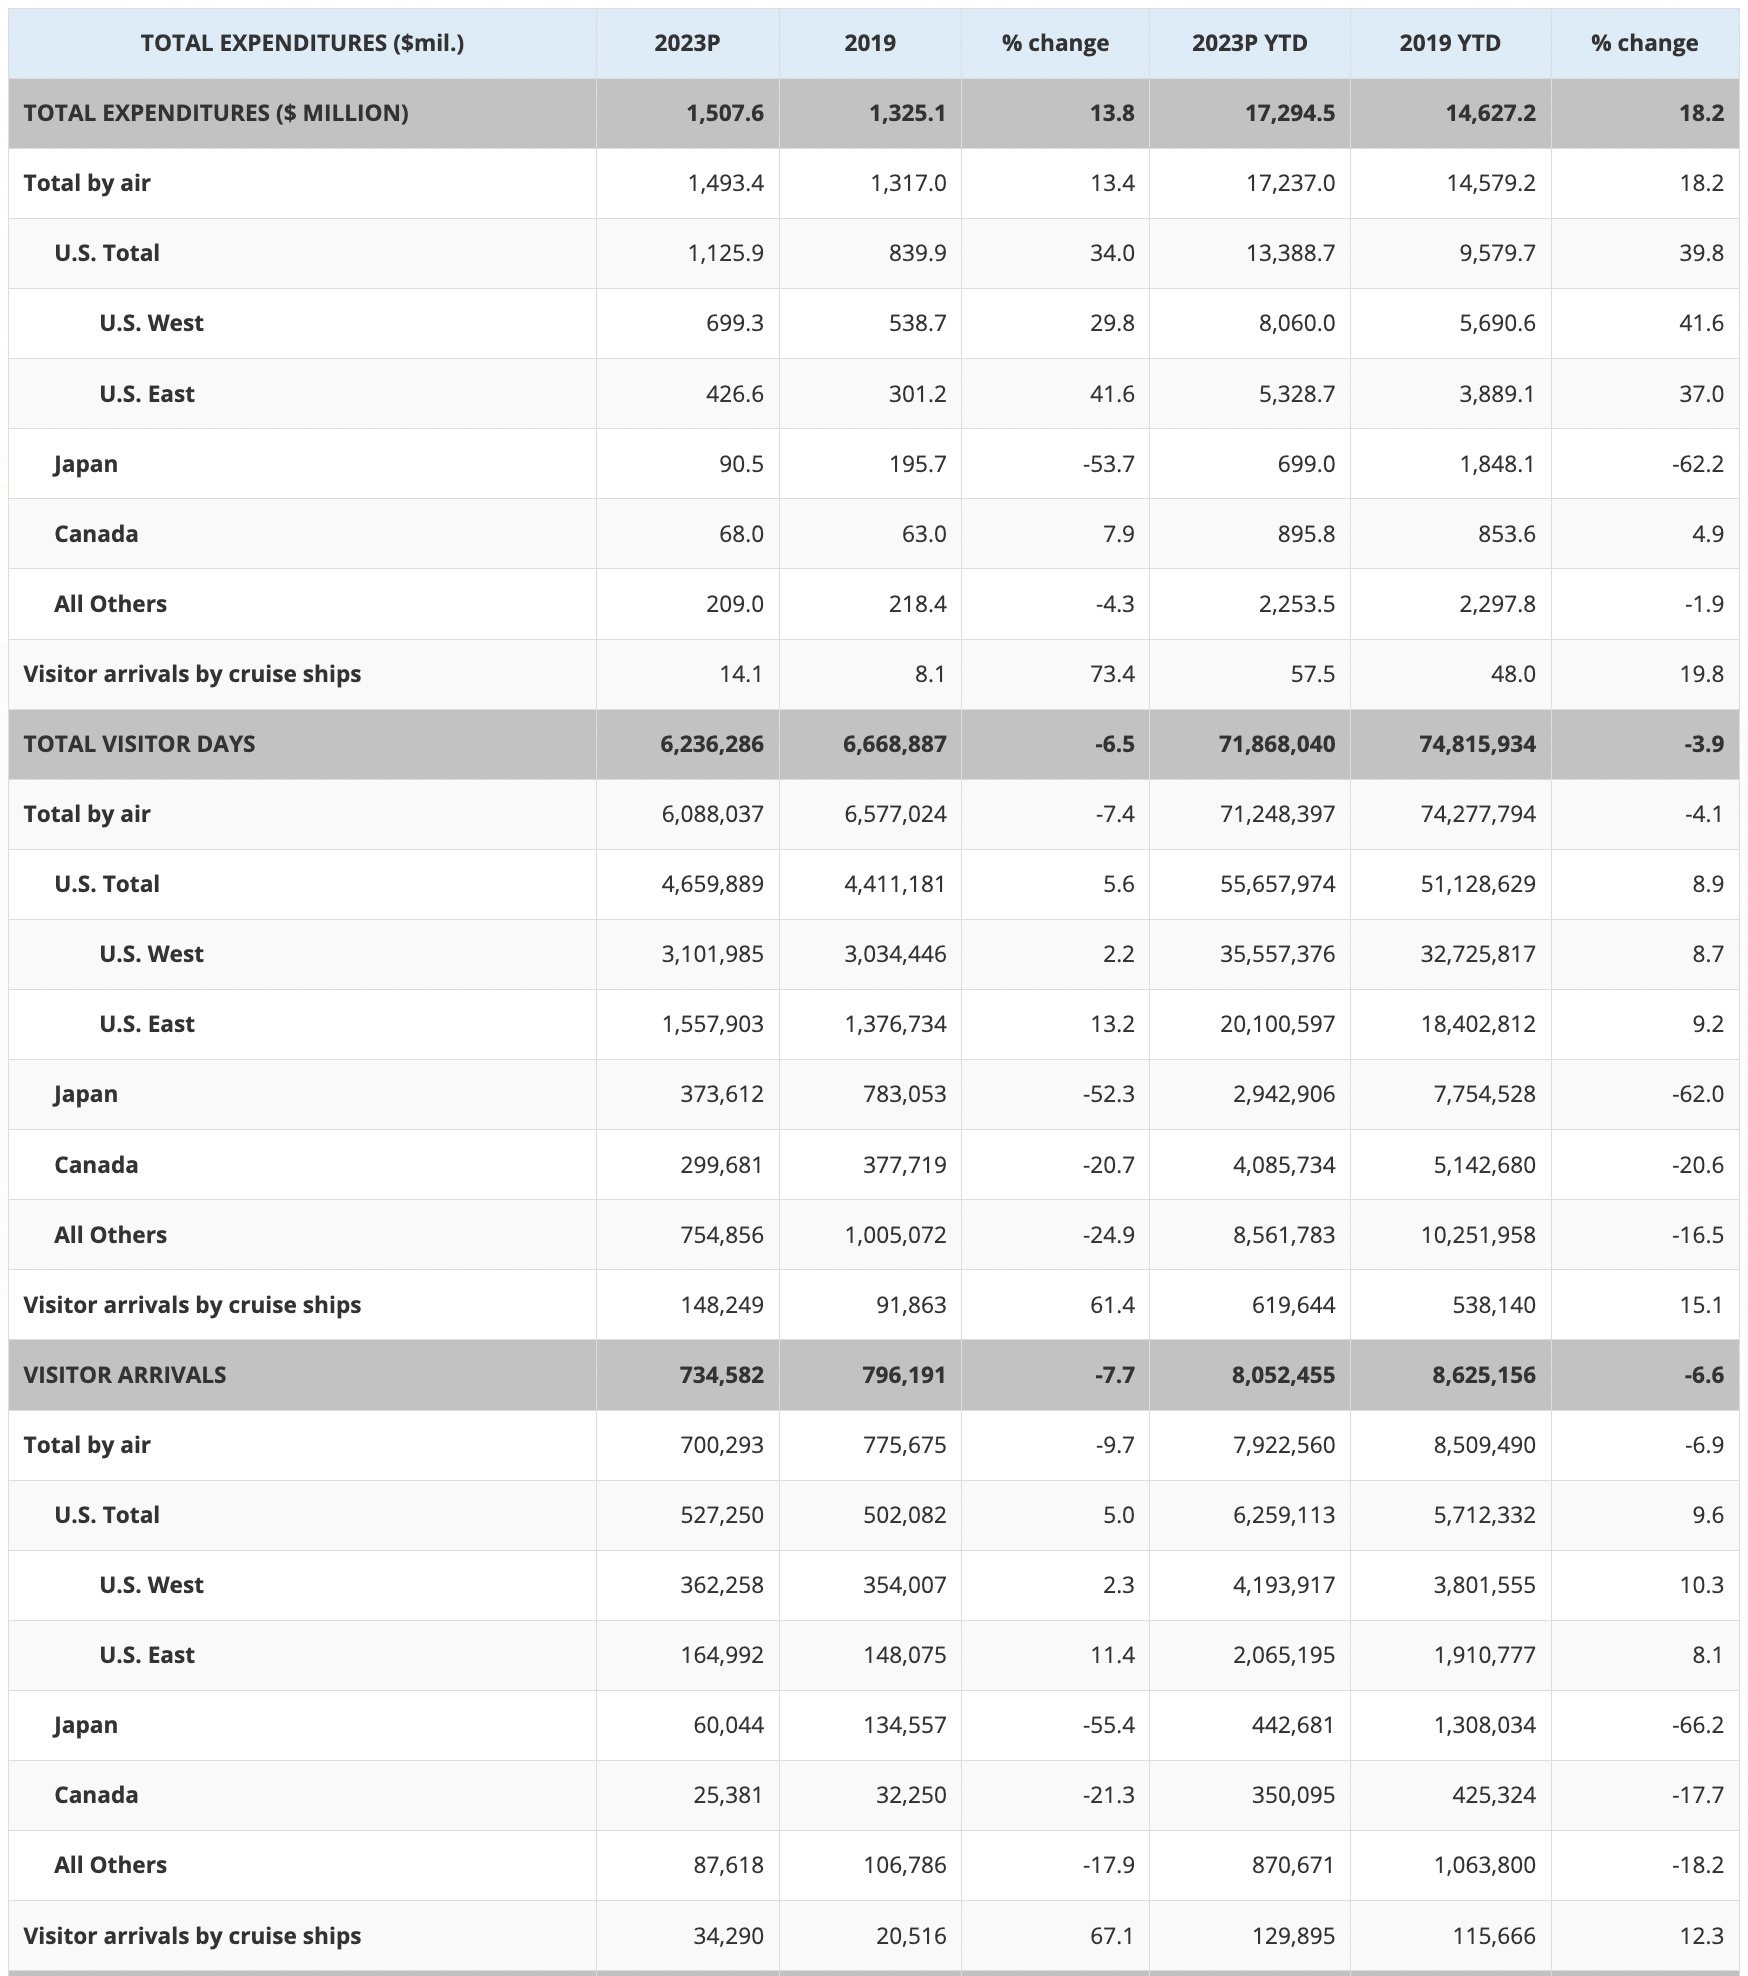
Source: DBEDT.Hawaii.gov
All pau. Mahalo

Leave your opinion here. Please be nice. Your Email address will be kept private, this form is secure and we never spam you.