Kauai Real Estate Q4 Review
It is no secret at this point that non-urban real estate markets have been stellar since late spring / early summer of 2020 when the net effects of the Covid shock to the real estate market became clear. As we anticipated in our last update, this trend has continued. In a year on year comparison of Q4, nearly every sales metric showed monstrous improvements over Q4 of 2019.
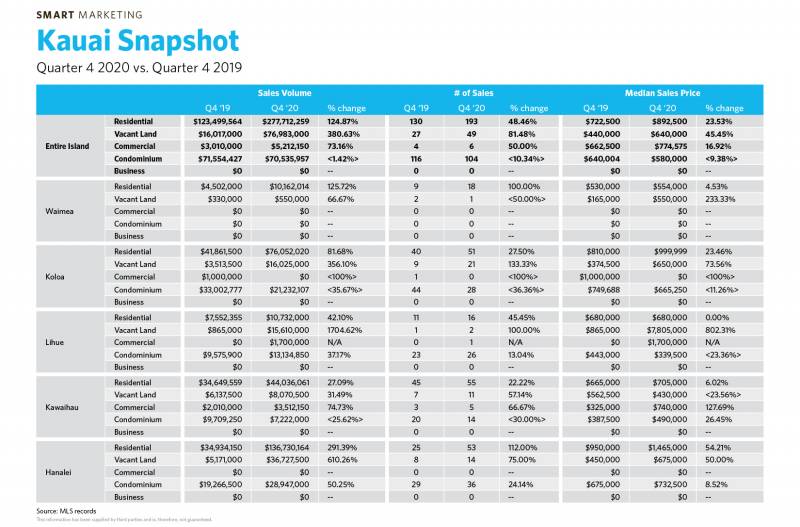
Starting with island-wide residential sales volume, the market saw an increase of roughly 125%, from $123.5M in Q4 2019 to $277.7M in Q4 2020. Similarly, vacant land sales volume jumped to $77M in the last quarter, up from $16M in Q4 of 2019, a 380% increase. In terms of number of sales, the past quarter saw 193 island-wide sales compared to 130 in the last quarter of 2019. For vacant land, number of sales jumped from 27 to 49, an increase of 81.5%. Median prices in these two segments also jumped with median residential properties at $892,500 in the last quarter compared to $722,500 in Q4 of 2019, a 23.5% increase, and median prices of vacant land now at $640,000 compared to $440,000 at the end of last year, a 45.5% increase. Islandwide condo metrics are relatively flat compared to Q4 2019.
The North Shore of Kauai also saw very strong numbers across the board. Q4 sales volume jumped to $136.7M in 2020 compared to $34.9M in Q4 2019, representing a roughly 290% increase. Land volume on the North Shore jumped 610% from $5.2M in Q4 2019 to $36.7M over the same period in 2020. Additionally, condo sales volume bucked the island-wide trend and jumped from $19.3M in sales volume to $28.9M during Q4 2020. Number of sales on the North Shore also saw significant increases with residential, vacant land, and condominium numbers of sales jumping 112%, 75%, and 24% respectively.
The fourth quarter also saw numerous noteworthy sales with six trades in the fourth quarter at sold prices greater than $10M. One of these sales was in the Lihue District; the other five trades were in the Hanalei District, which comprises Kauai’s North Shore from Kilauea to Haena.
If you’d like to explore the numbers a bit deeper, check out the market snapshot below for Q4, or via the following link for an enlarged version – Kauai Snapshot Q4.

Monthly Sales and Median Price Statistics
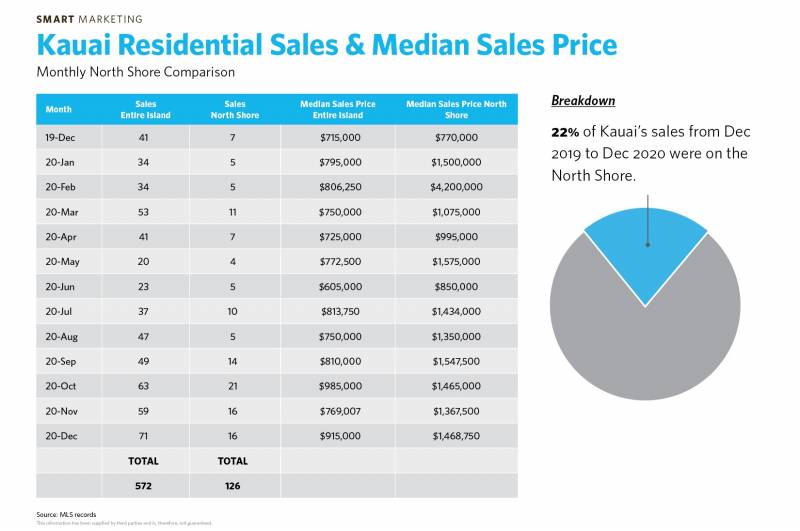
The below chart depicts monthly sales and median prices for both the entire island and the North Shore. This chart also emphasizes the strength of the metrics we mentioned in the paragraph above. For both the North Shore and the entire island, the past three months comprise the top three months in terms of number of sales over the sample period.
Kauai Monthly Residential Sales & Median Sales Prices.

Long Term Quarterly Median Sales Price Trends
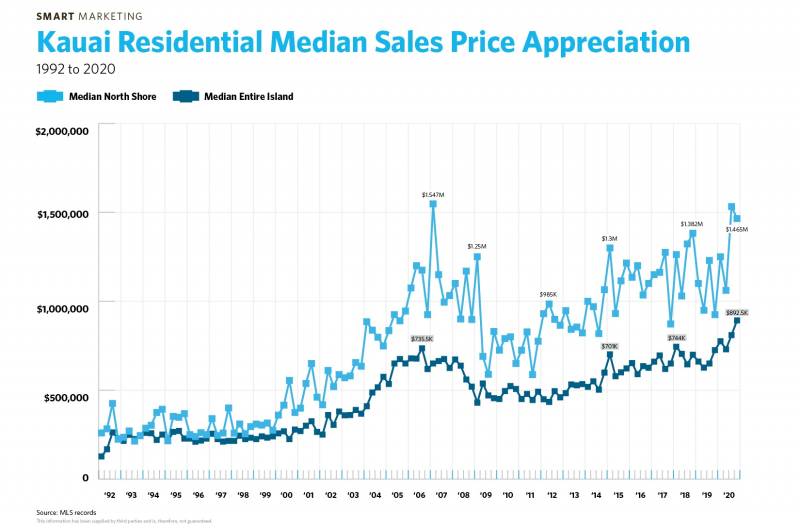
The island-wide quarterly median sales prices have surpassed the peak of the mid-2000s. North Shore median prices are more or less hovering at that peak. In light of these at or near record prices in our market, we have taken our data set back as far as the MLS offers quarterly median sales price data. The steady trend upwards since 2009 is clear on both data plots, and with a relatively fixed supply and continued growing demand, it seems for the near future this trend line is likely to continue its path.
Kauai Quarterly Residential Median Prices, 1992 to 2020.

Explore more of our beautiful listings at www.nealnorman.com.


Leave your opinion here. Please be nice. Your Email address will be kept private, this form is secure and we never spam you.