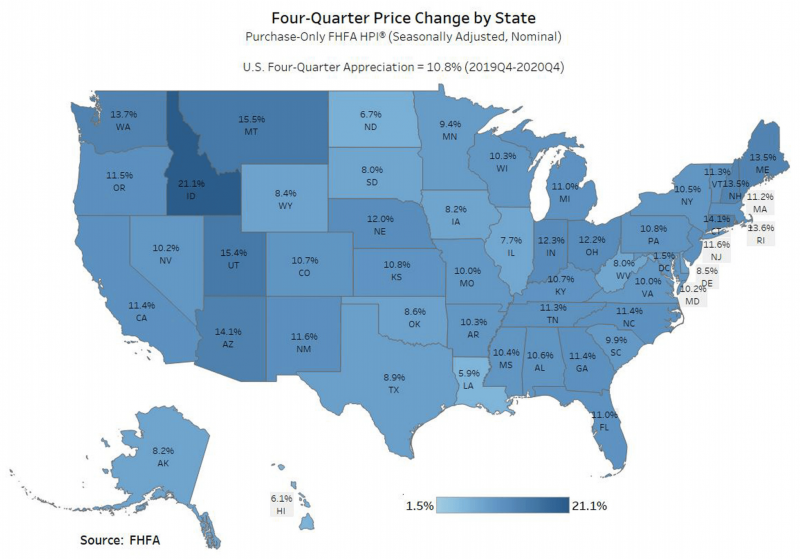
If we look at the nation’s big picture, house prices rose 10.8% in 2020 (Q4 to Q4). There were price increases in all 50 states and the District of Columbia. Prices rose 3.8% in the fourth quarter. Both increases are the largest gains in 25+ years! (Source: FHFA.gov)
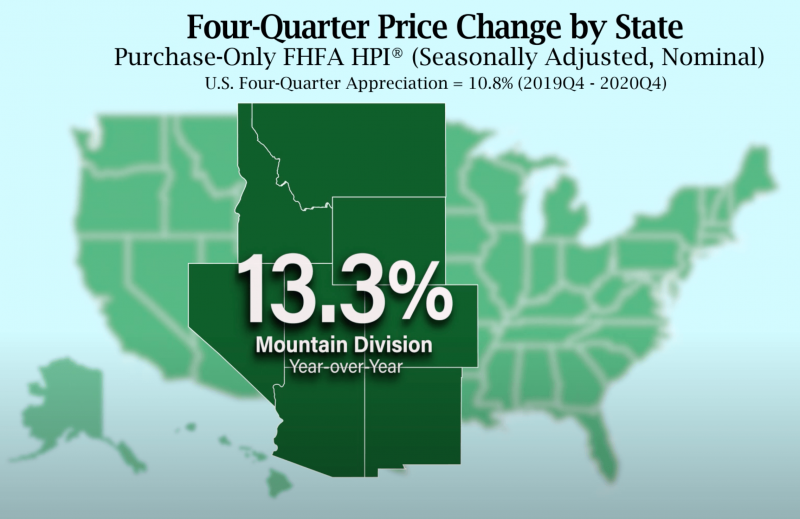
The Mountain Division has lead the price appreciation charge now for 13 straight quarters. (Source: FHFA.gov)
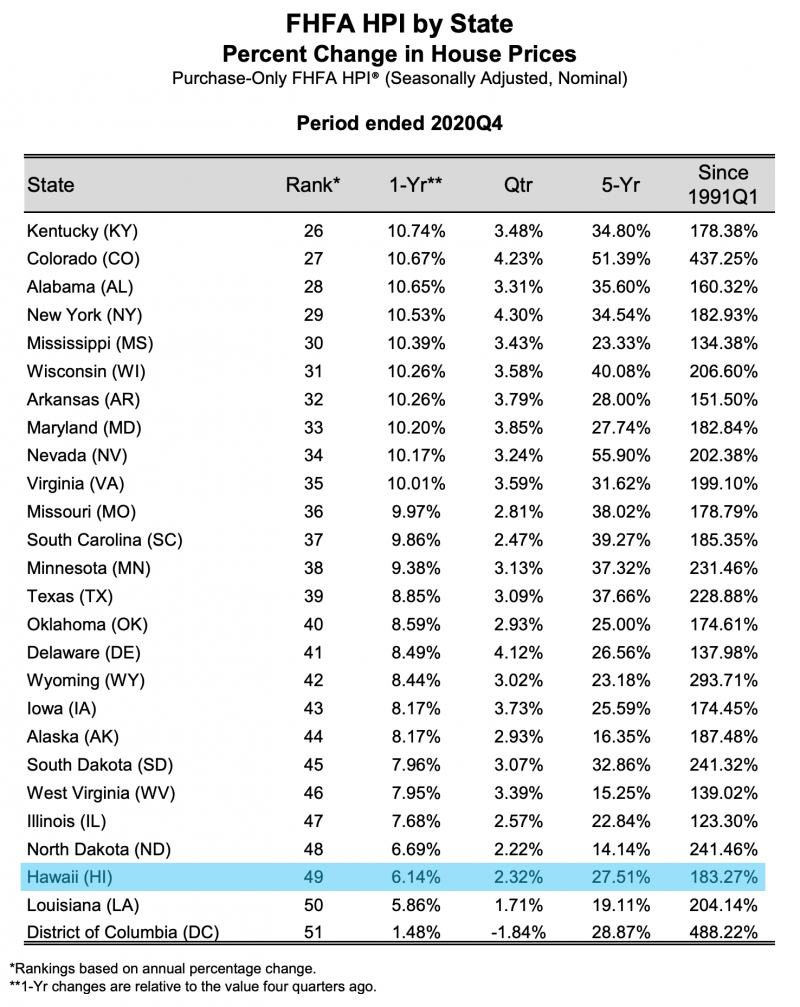
The state of Hawaii was up a respectable 6% thru the 4th quarter (YOY), but this was only 49th overall. (Source: FHFA.gov)
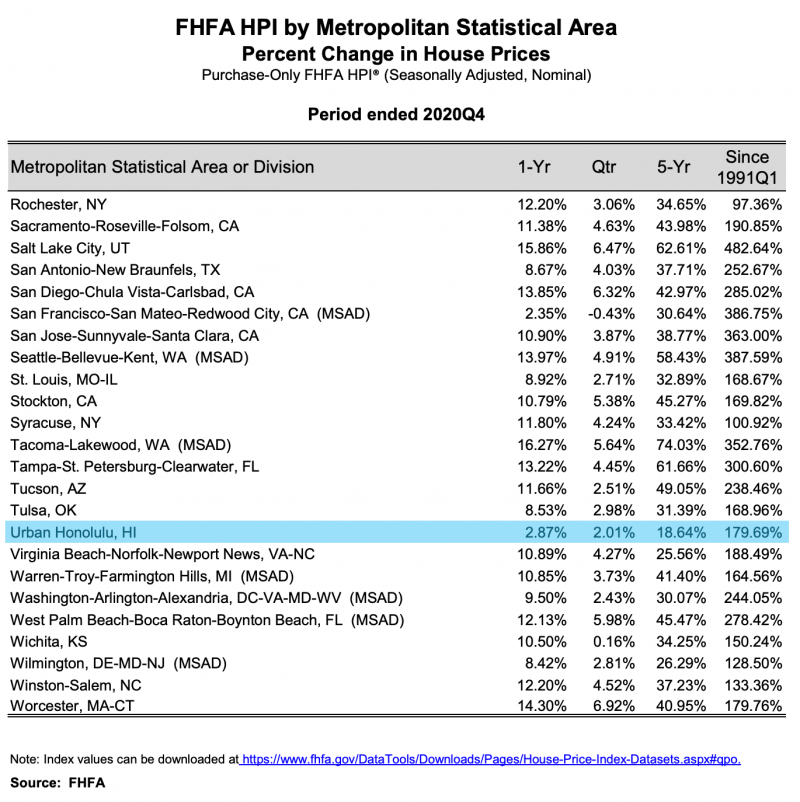
The city of Honolulu was up about 3%, which put it in the bottom 20 metropolitan areas in the nation. (Source: FHFA.gov)
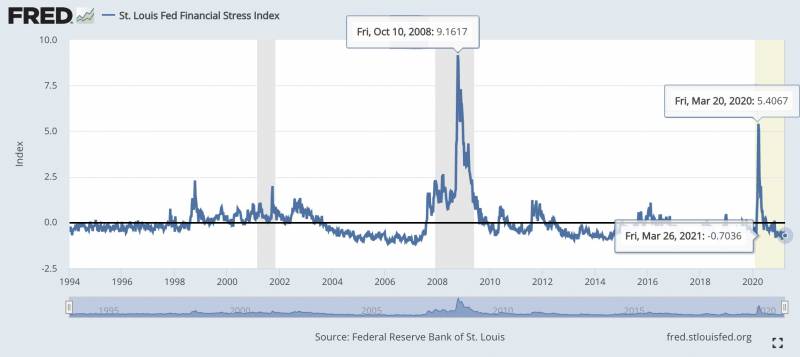
The nation’s economic stress indicator, at the end of March, was -.7 points, which is down considerably from the highs of 5.4 a year ago, at the onset of Covid shutdowns. Currently, stress numbers are also way down from the index’s highs of 9 points during the Lehman Brother’s 2008 collapse and financial crisis. (Source: fred.Stlouisfed.org)
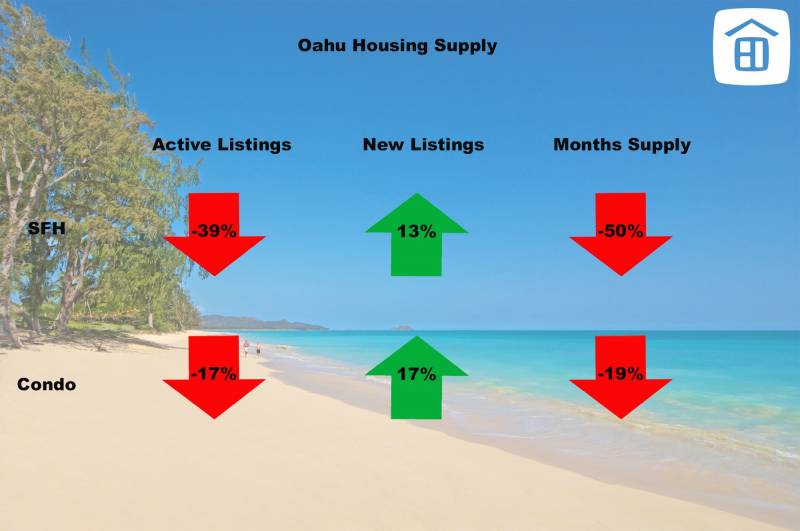
Oahu has a 1.3 months supply of single-family and 2.9 months of condominiums. This means that at the current sales rate, there would be no more homes for sale in 1-3 months. 6 months of supply is considered a “balanced market.” Anything less a “seller’s market” and greater than 6 months is a “buyer’s market.” (Source: hicentral.com)
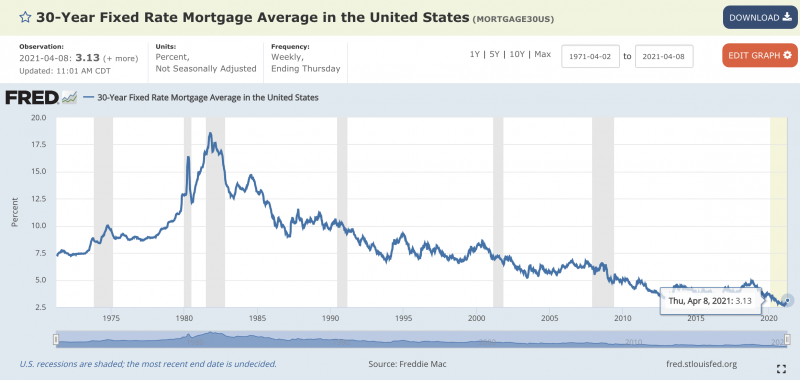
Mortgage rates are historically low and fueling demand for real estate. (Source: fred.Stlouisfed.org)
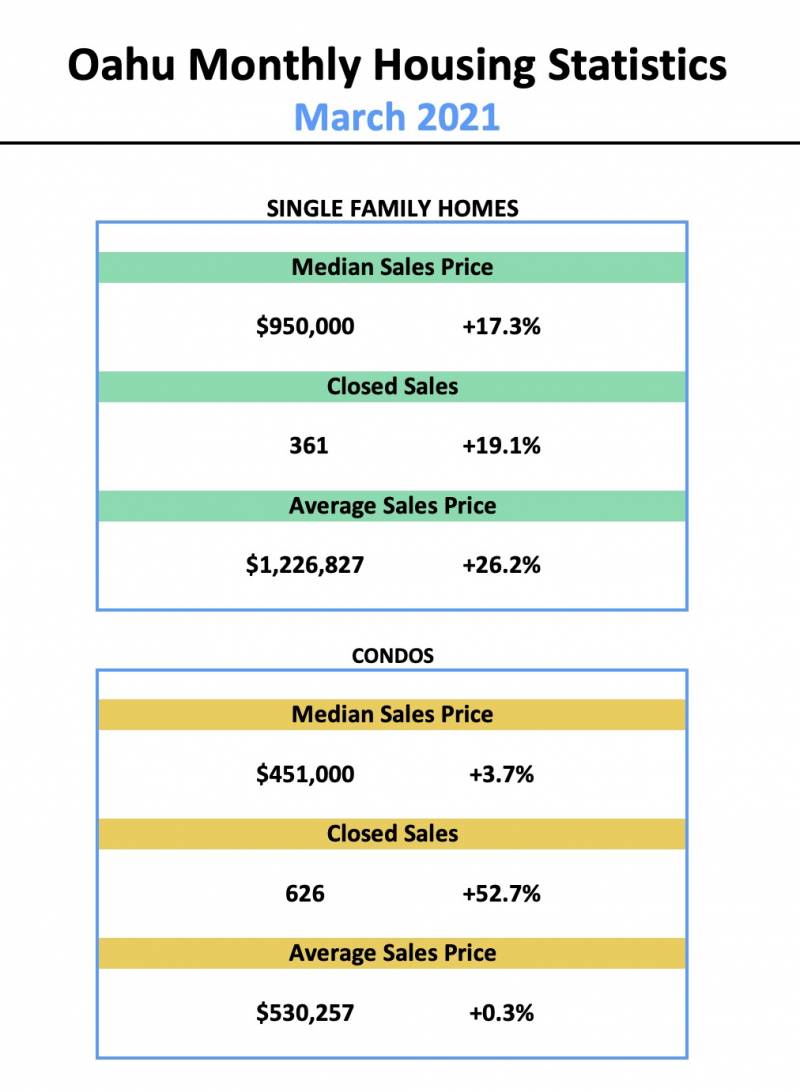
With a tight supply and demand kept high with low interest rates, it is no wonder that Oahu’s median price hit $950,000 for single-family and $451,000 for condominiums in March. Up 17% and 19%, respectively. (Source: hicentral.com)
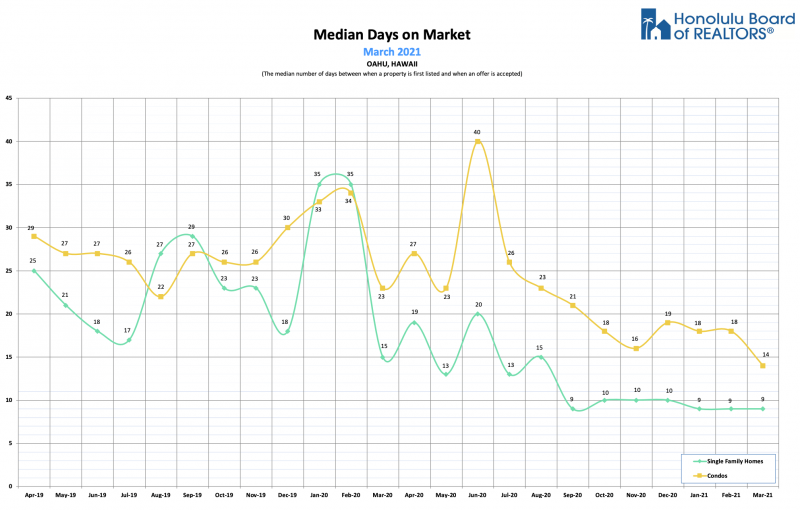
Days on market is a good measure of “market velocity” or how quickly homes are selling. In March, market velocity for single-family homes is about 14 days for SFH and 9 days for condos. These numbers are down about 40% for single-family homes and 45% of condominiums, year over year. (Source: hicentral.com)
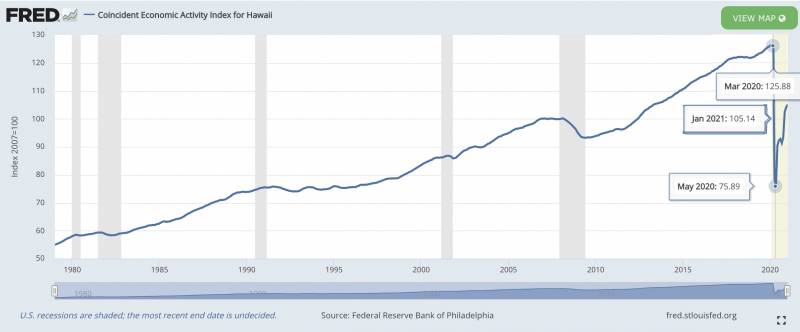
If we look at Hawaii’s Economic Index, we can see that Hawaii’s economy was at record highs of 126 points before the shutdowns hit. 76 points was the bottom of the recession, and our economic activity has recovered just over half of the losses to its current standing of 105 points. (Source: fred.Stlouisfed.org)
DBEDT reports that in February 2021, there was a daily average of ~90k tourists in the state of Hawaii, which is down considerably from last year’s average of 250k. Every metric is down except average length of stay, which is up 34% (YOY). (Source: dbedt.hawaii.gov)
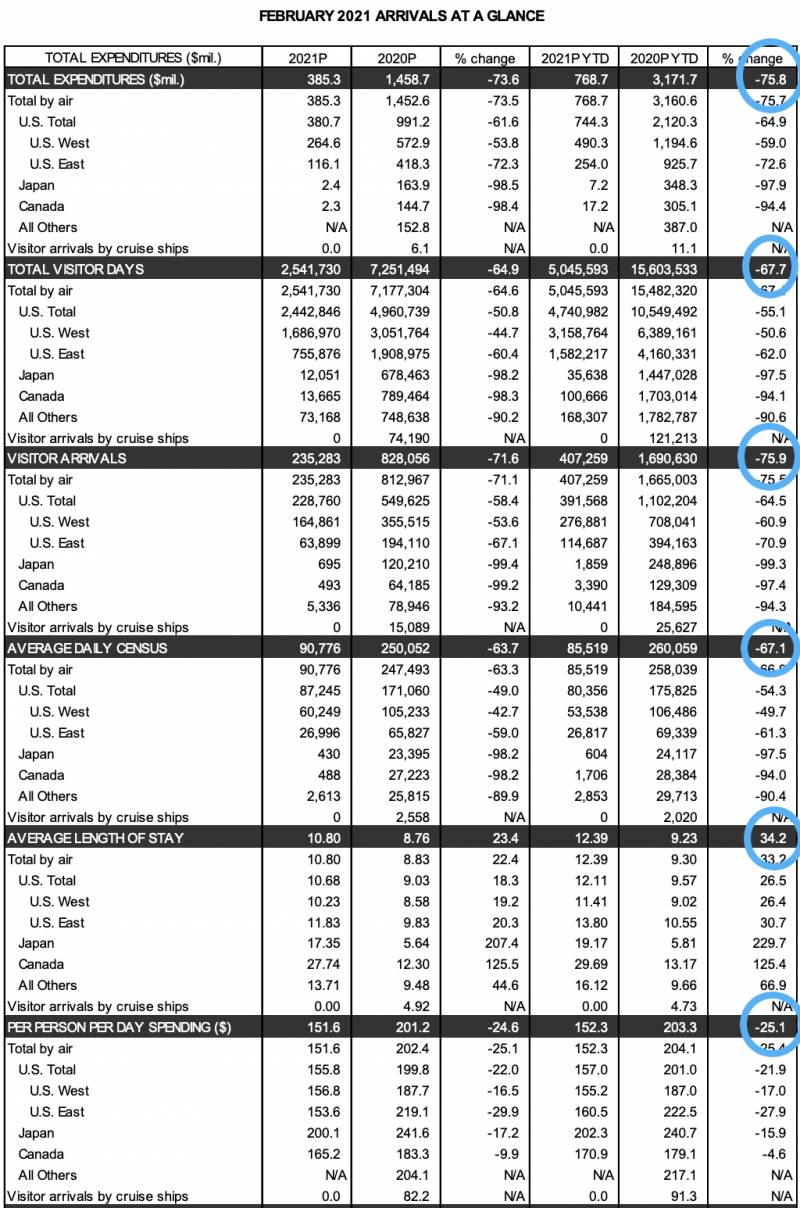
Despite the overall bleak numbers, tourism showed definite signs of life over spring break. Arrivals were with in 20-30% of 2019 levels.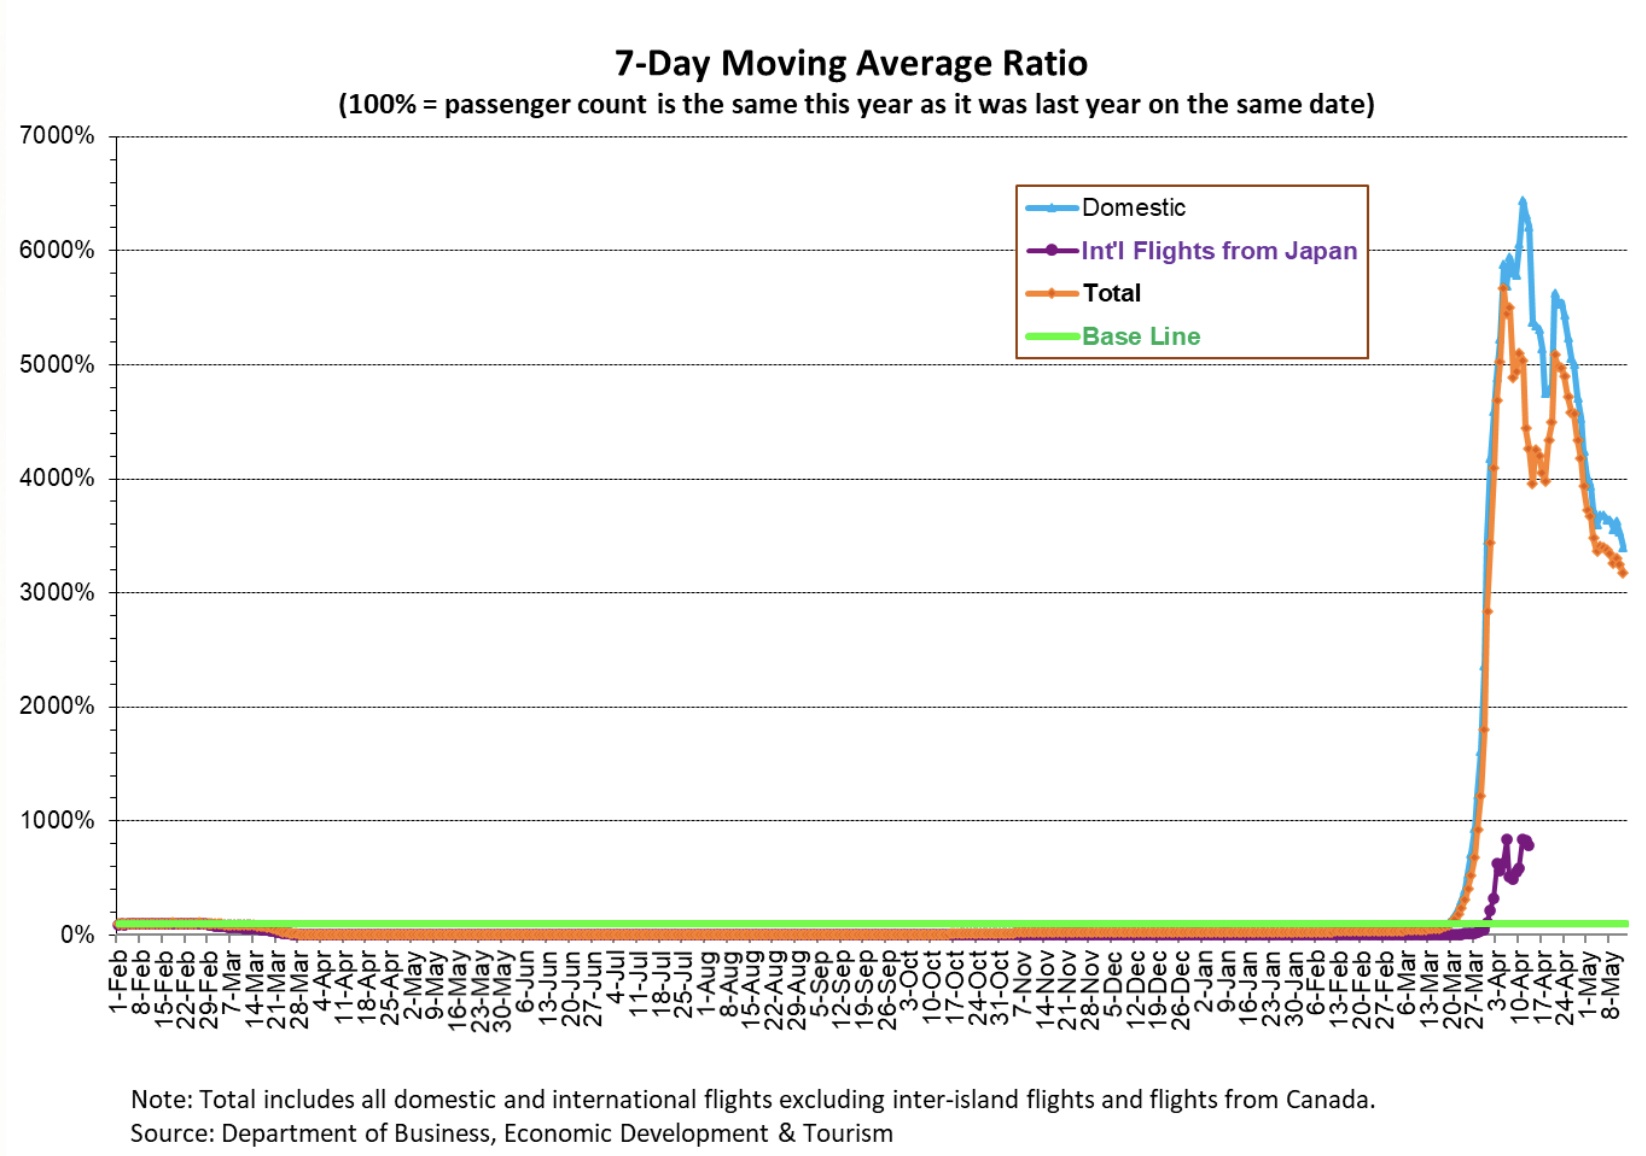
Where are Hawaii’s buyers coming from? With the worldwide pandemic going on and a lot people fleeing the big cities, foreign investment on Oahu is down for 2020. Foreign investment volume has steadily been on a ~19% decline since 2017. ~98% of the trades on Oahu are “local transactions” between residents of Hawaii.

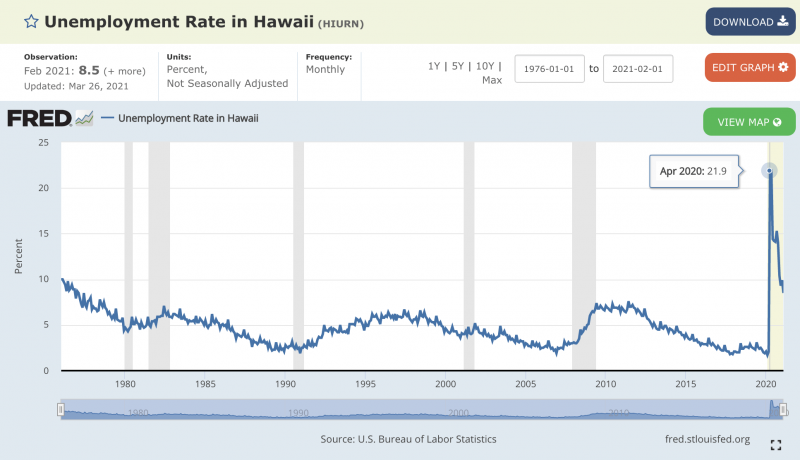
Hawaii’s unemployment rate has dropped from April’s highs of about one in five people (~22%), down to 8.5%. (Source: fred.Stlouisfed.org)
In summary, for the 1st quarter of 2021, prices are up due to low supply and high demand. Properties are selling 40-45% quicker. The financial stress indicator is low, unemployment has come down from 1 in 5 people to under 1 in 10, and Hawaii’s economy is halfway back to levels prior to C19.

Stuart Woodfin
April 22, 2021
Aloha Jake,
Great data!, It would be interesting to see what percentage of visitors turn to looking for real estate and then become actual buyers. I realize there’s really no way of capturing that data, but it would be most interesting to see! Another thing I think about is actual land percentage that is developed in comparison to land left that can be developed both residential home/condo and then commercial. I know there’s a fine line when it comes to how much the island can handle due to infrastructure capabilities while maintaining Oahu’s beautiful untouched qualities. Great statistics and I appreciate the data you’ve collected and shared. Mahalo from the Big Island.