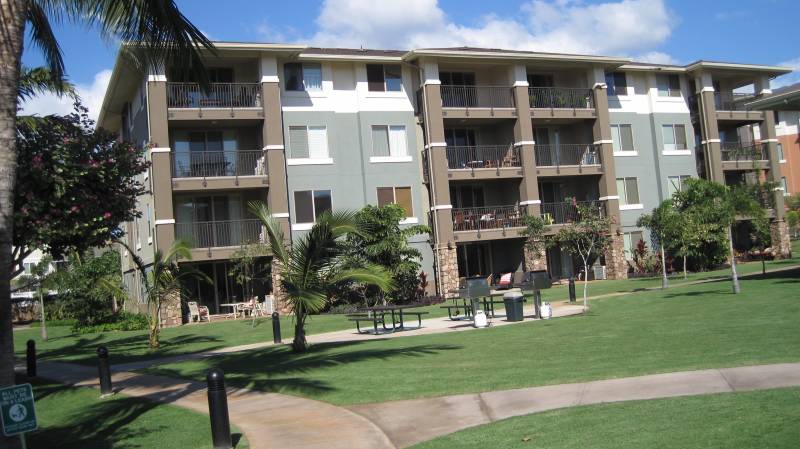
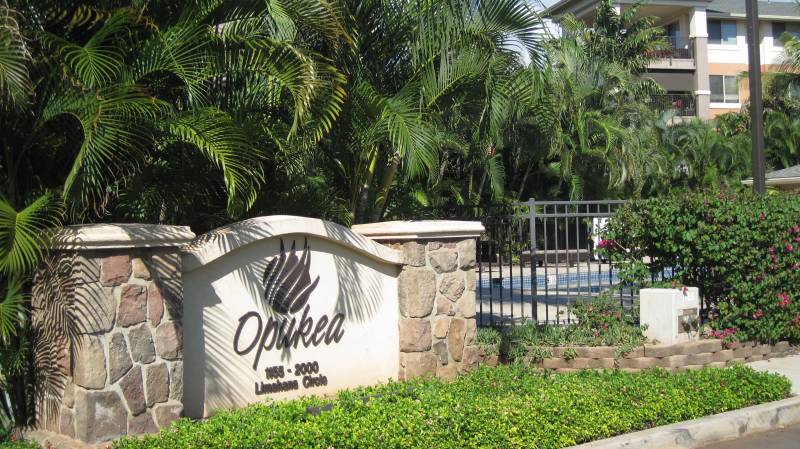
As part of my commitment to keeping the community informed about West Maui’s resort laden, micro-market real estate environment, I’m bringing you an up-to-date, comprehensive property market summary of Opukea, Lahaina Town’s premier local condo community.
What You’ll Find
- Actual Sales Prices: learn exactly how much specific properties sold for
- Sales Volume: see the strength of the market in terms of how many properties sold
- Days on Market: understand how long it takes the average property to sell
- List Price vs. Sold Price: see how the final sales price compares to the listing price
- Price Per Square Foot: which is critical in calculating real estate values
- Asset % Growth: what is the year over year appreciation if my property
- Current Inventory: what is actively for sale and currently under contract
Before we dig into the numbers, make sure you subscribe to my blog if you want to be notified of future Opukea market reports as they come available.
2019 Market Snapshot
- Opukea sales have been moderately hot this year. In summary — volume is steady, avg sales prices are up 17%, and days on market well under the West Maui average for comparable property. This marks the 6th year in a row that Opukea has seen positive price growth.
- Days on Market from time of listing to closing is averaging 139 days (West Maui average = 220 days). The comparative is from other West Maui condos communities that do not permit or allow vacation rentals.
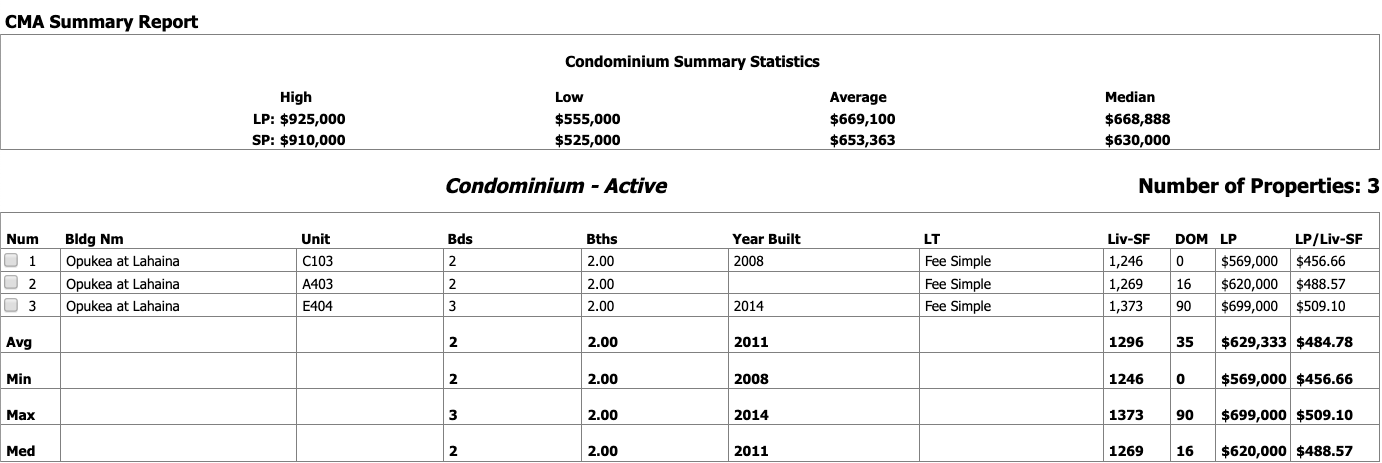
- Currently, there are 3 actively listed units for sale and 1 pending.
Historical Sales Summary (click on the images/links for interactive)
|
Opukea at Lahaina
|
|||||||
| Year | Avg List Price | Avg Sold Price | % List Sell | % Yr Gr | $/Sq Ft | DOM | # Sold |
| 2019 | $687,863 | $665,200 | 97% | 17% | $460 | 139 | 10 |
| 2018 | $583,685 | $567,262 | 97% | 4% | $432 | 92 | 13 |
| 2017 | $559,122 | $545,462 | 98% | 2% | $417 | 100 | 13 |
| 2016 | $539,880 | $534,533 | 99% | 5% | $387 | 139 | 20 |
| 2015 | $510,021 | $509,283 | 100% | 10% | $372 | 148 | 36 |
| 2014 | $468,345 | $462,292 | 99% | 15% | $354 | 76 | 13 |
Bedroom Bathroom Breakdown
|
Opukea at Lahaina
|
|||||||
|
2 Bedroom
|
|||||||
| Year | Avg List Price | Avg Sold Price | % List Sell | % Yr Gr | $/Sq Ft | DOM | # Sold |
| 2019 | $562,500 | $545,000 | 97% | 7% | $437 | 100 | 2 |
| 2018 | $521,129 | $507,057 | 97% | -1% | $402 | 94 | 7 |
| 2017 | $518,932 | $510,917 | 98% | 6% | $408 | 83 | 6 |
| 2016 | $482,038 | $482,038 | 100% | 6% | $386 | 120 | 6 |
| 2015 | $457,875 | $456,054 | 100% | 7% | $362 | 143 | 14 |
| 2014 | $437,686 | $426,283 | 97% | 12% | $340 | 67 | 7 |
|
Opukea at Lahaina
|
|||||||
|
3 Bedroom
|
|||||||
| Year | Avg List Price | Avg Sold Price | % List Sell | % Yr Gr | $/Sq Ft | DOM | # Sold |
| 2019 | $663,271 | $639,500 | 96% | 0% | $468 | 168 | 6 |
| 2018 | $656,667 | $637,500 | 97% | 11% | $467 | 89 | 6 |
| 2017 | $593,571 | $575,071 | 97% | 9% | $425 | 114 | 7 |
| 2016 | $537,532 | $529,703 | 99% | 3% | $389 | 149 | 12 |
| 2015 | $516,241 | $516,083 | 100% | 2% | $380 | 162 | 19 |
| 2014 | $504,113 | $504,302 | 100% | 19% | $371 | 86 | 6 |
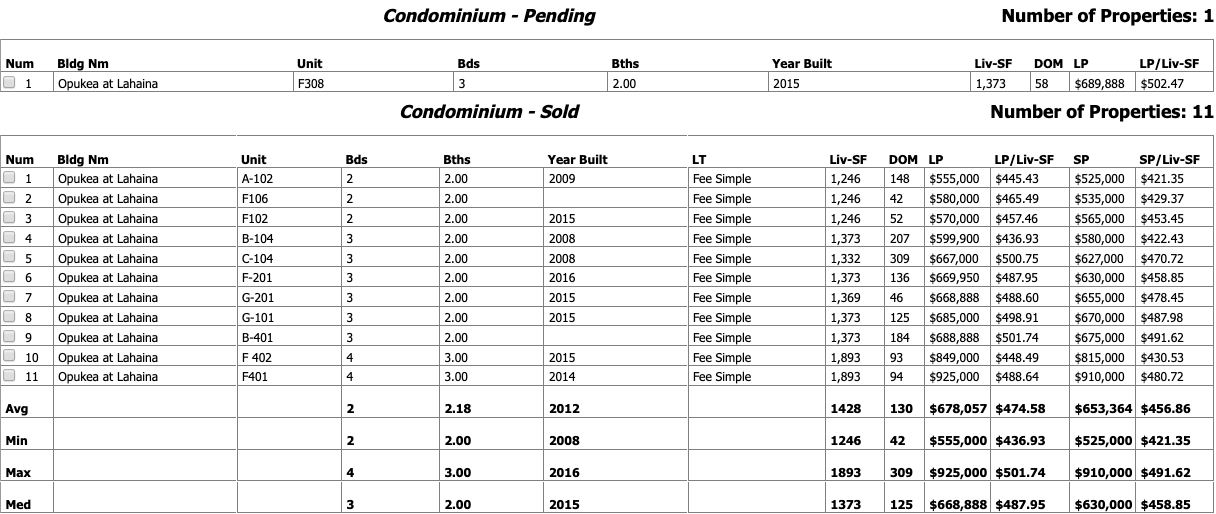
2019 Opukea at Lahaina: Actives & Solds
Want to Know More?
If you are in the market for buying or selling Opukea real estate or have any questions about the area or the market in general, please feel free to contact me. I welcome the opportunity to give you information on my previous sales performance and marketing strategies. Or if you’re curious about what your property is worth in today’s market, it would be my pleasure to provide you with property information and a value assessment free of any sales pitch.

Leave your opinion here. Please be nice. Your Email address will be kept private, this form is secure and we never spam you.