If we look at the big picture, US house prices rose an average of 17.4% from the 2nd quarter 2020 to 2nd quarter 2021.
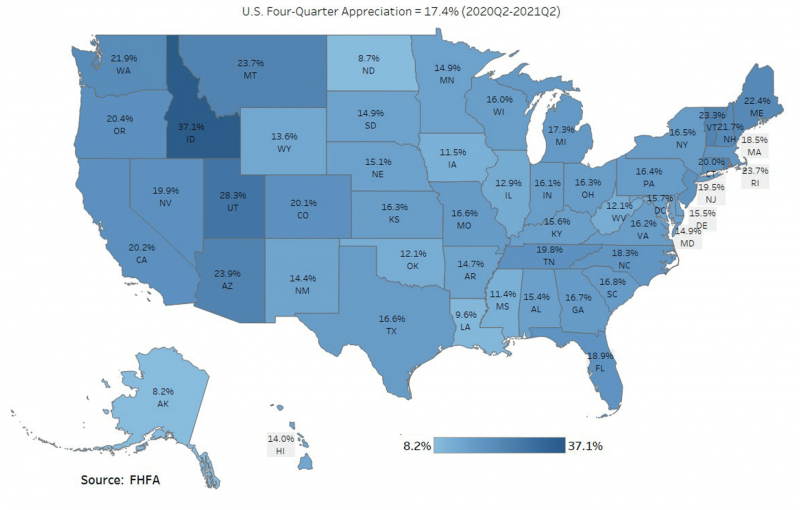
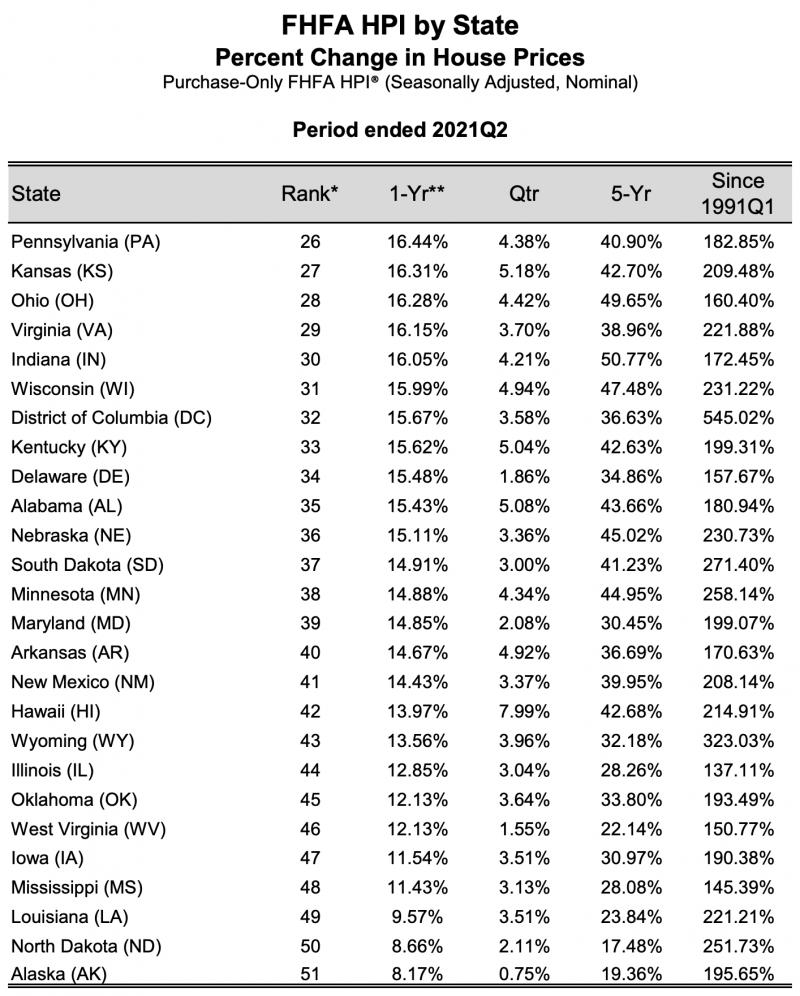
The state of Hawaii is ranked 42nd, with a 14% appreciation.
Idaho and Utah lead the nation with 37% & 28% price appreciation, respectively.
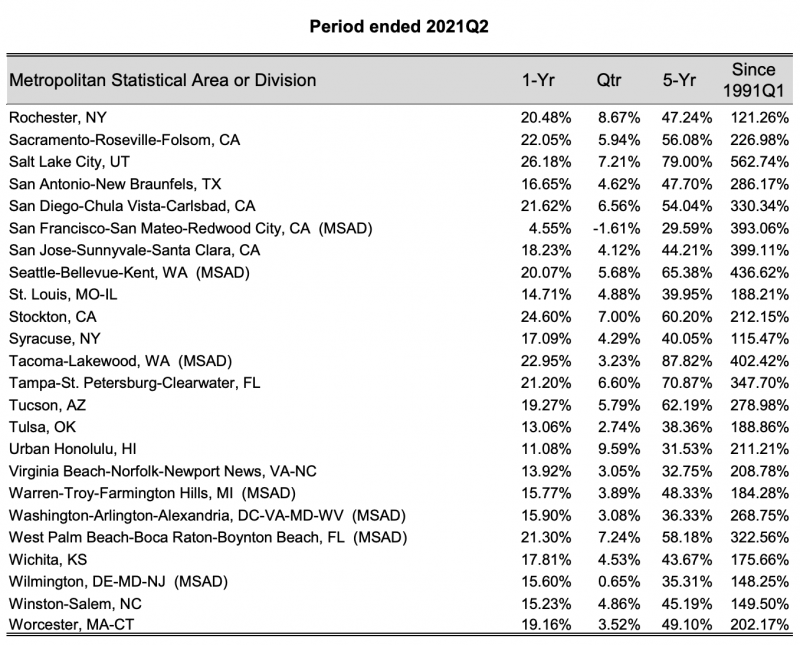
The City and County of Honolulu is up 11%, year over year. Honolulu is ranked 97th in the nation after cities, like #1 Boise City, ID, up 41%, and #2 Austin-Round Rock-Georgetown, TX, up 35%, year over year.
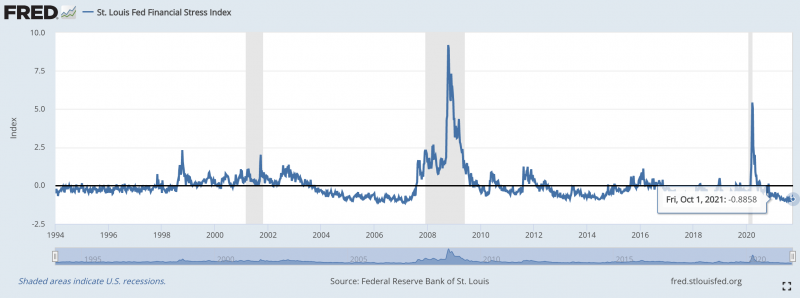
The nation’s Financial Stress Index on October 1st, 2021, was -.88 points. This is down from 5.48 points on March 20th, 2019 (Onset C19). You can see we are down from the index’s highs of nearly 9 points during the 2008 recession, highlighted in gray.
In September, all the supply indicators are down significantly across the board, with the exception of new listings. Months of supply, is historically low, between 1 and 2 months.
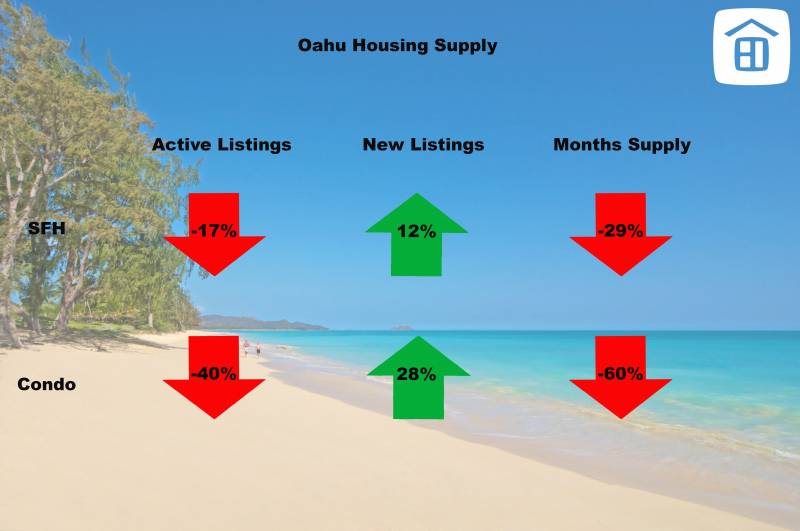
Incredibly low supply on the market puts upward pressure on median sales prices and closed sales volume. Days on market continues to decrease.
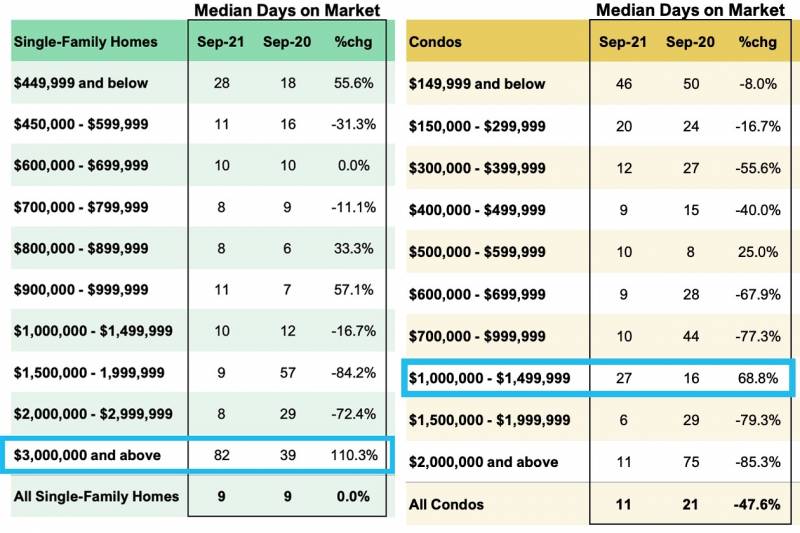
If we compare market velocity and price point, on Oahu single family homes, we see it is fairly consistent at the low end of prices at around 9 days on the market to sell. Once we hit the $3M+ price point, it takes 9x longer to sell. For condos, the breaking point is at about $1M.
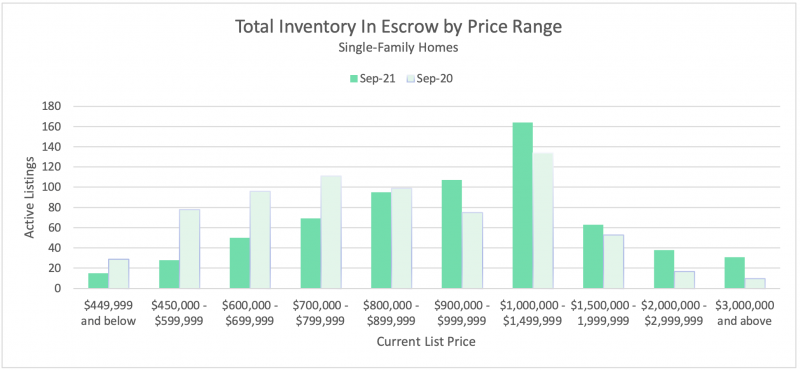
The current inventory of single family homes, that are in escrow, is predominantly in the $900k-$1.5M price range:
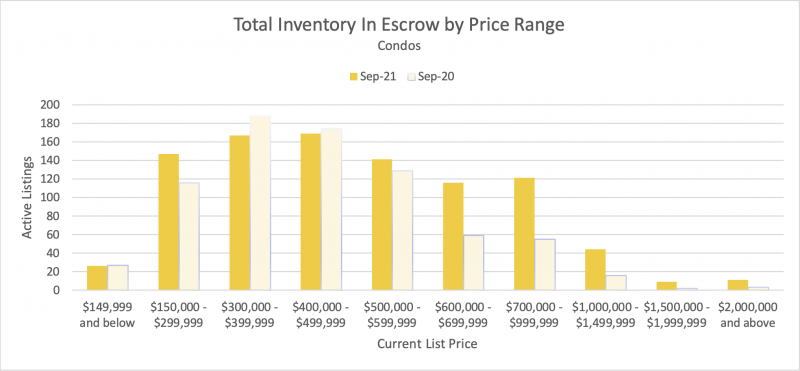
For condos, the predominant inventory that is in escrow, is in the $300k-$500k price range.
Days on market is a good measure of “market velocity” or how quickly homes are selling. In the September, market velocity is about 10 days for both SFH and Condos. Market Velocity is up about 50% for both single family homes and condominiums, year over year.

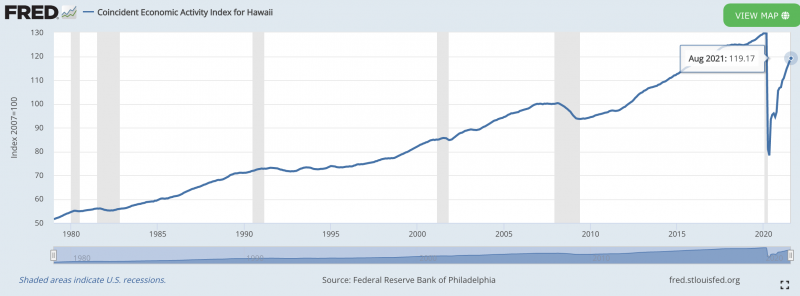
The line in the graph represents an index that’s tracks Hawaii’s economic activity. We can see the last 6 US recessions highlighted in gray. Since the onset of C19, in the spring of 2020, the index plummeted 40%, from the all time highs of 130 points, to the lowest levels since the late 1900s. Since the bottom of the market, in May 2020, we are back with in 11 points of the charts all time highs.
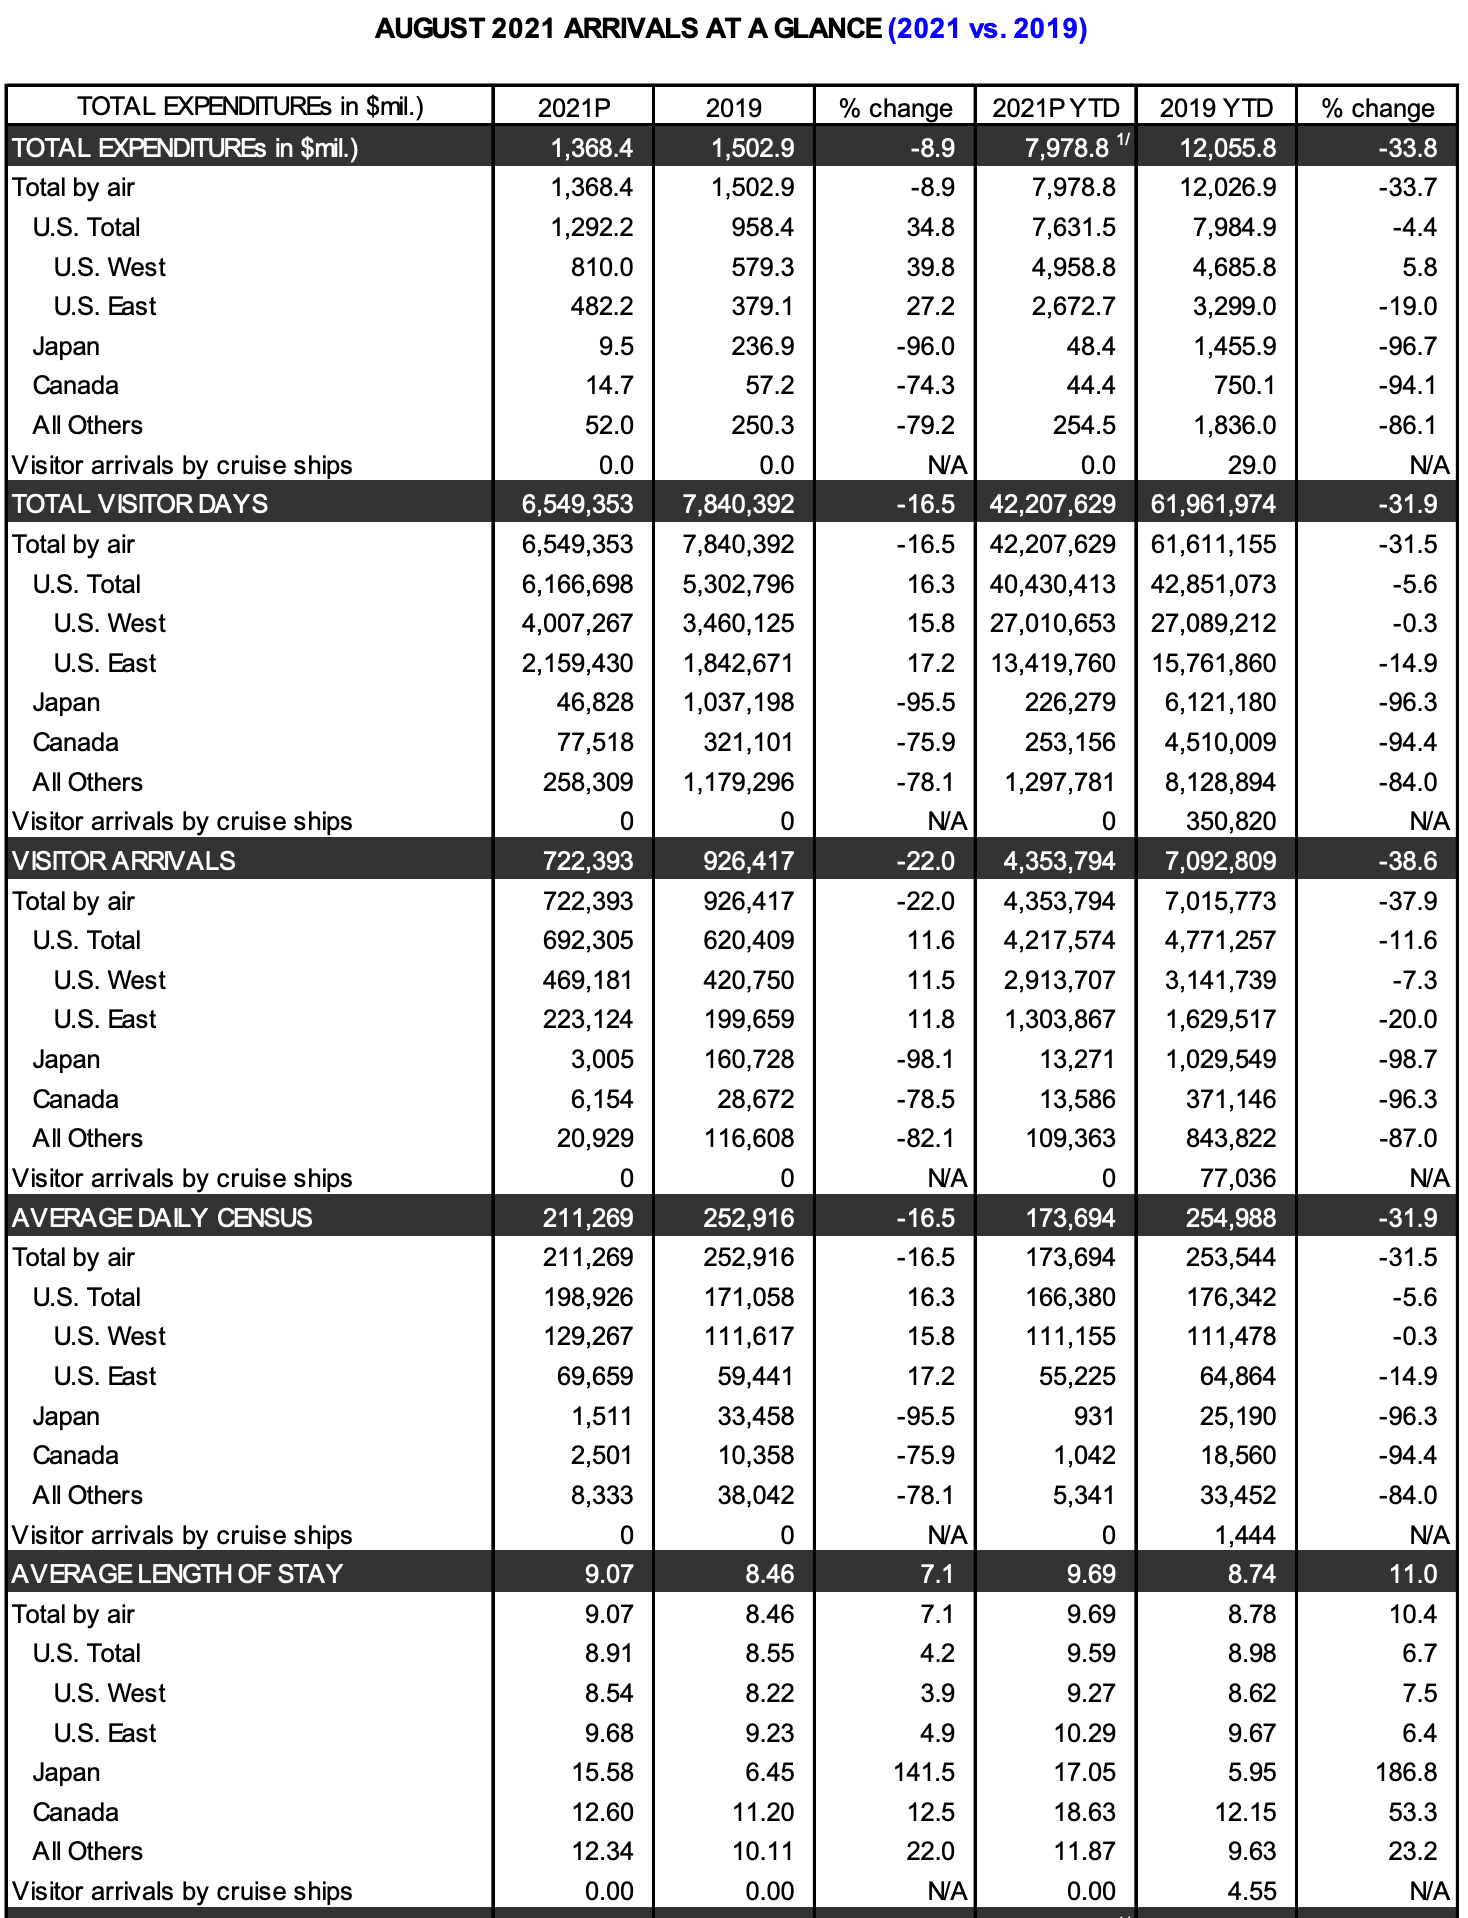
August 2021, visitor numbers are back within 30-40% of the record high tourist numbers of 2019.
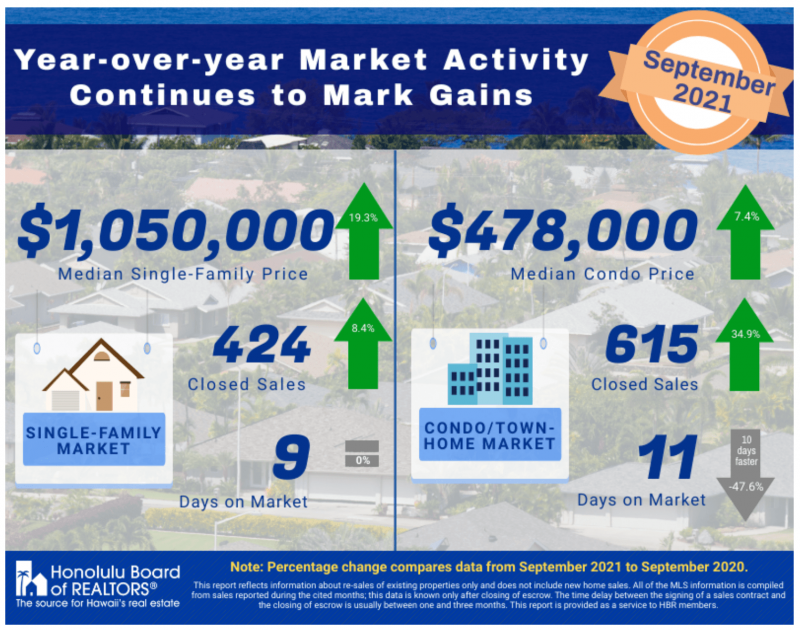
In summary, prices and closings were up for both categories as a result of the incredibly low supply on the market. Market velocity is at 10 days to sell property and Hawaii’s economy is back within 30-40% of pre C19 levels.

Kim Leslein Soares
October 14, 2021
Jake: Excellent deep dive on information and stats. Thank you!
Cherie Tsukamoto
October 14, 2021
Great market report, Jake!