As we navigate through the real estate market together, I will be sharing monthly real estate statistics from the REALTORS® Association of Maui (RAM).
All the charts and commentary below are from RAM’s Report © 2022 ShowingTime.
The information above is presented within the standard framework. The data for new listings by category or class encompasses the entire island of Maui. The district information is confined to the most active districts.
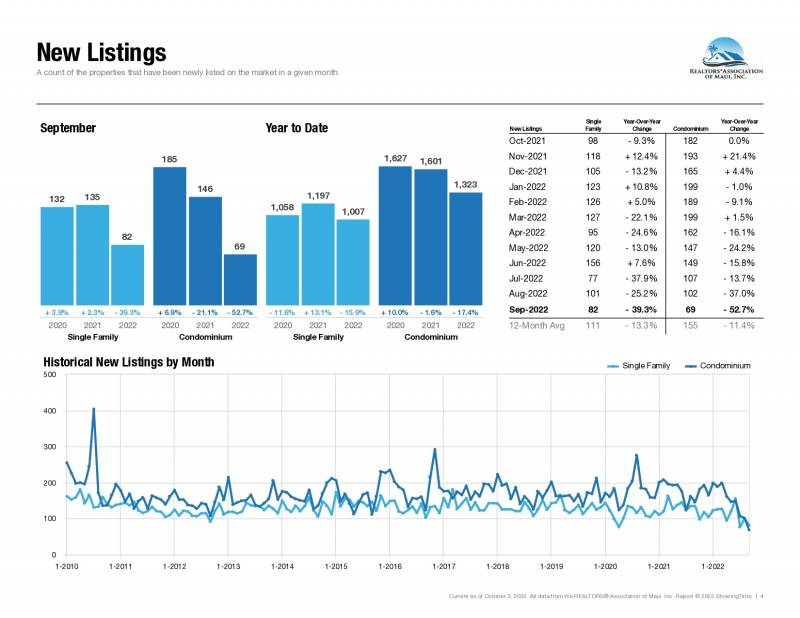
- The inventory of newly listed homes fell to 82 in September 2022, down from 135 in the same month in 2021.
- Condominium listings fell dramatically in September 2022, with only 69 new listings compared to 146 in September 2021.
- There was also a reduction of 190 listings in September 2022, which totaled 1007 compared to 1197 in the same month in 2021.
- There was also a decrease in condominiums from 1323 this year in September to 1601 last year in the same month.

- The greatest drop in new pending sales was observed in August of 2022 for single-family listings, which dropped by 50% compared to the same month’s statistics in 2021.
- The greatest reduction in new pending sales was seen in June 2022 for condominium listings, which fell 56.2% from 2021.
- In September alone, the pending sales recorded for 2022 were 79 new pending sales compared to 114 in September 2021, a 30.7% decrease. The statistics for condominiums followed suit, with a 36% decrease with 87 new pending sales in September 2022 compared to 136 in the same month in 2021.
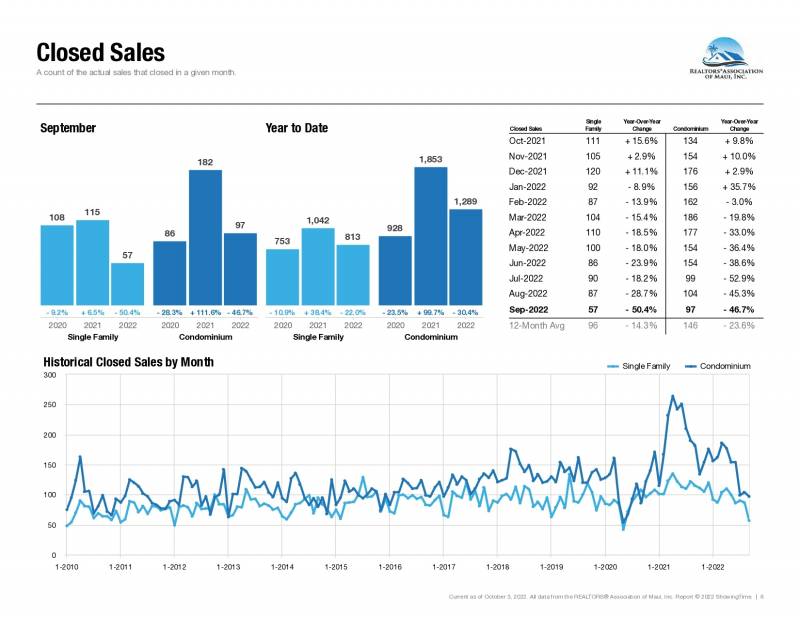
- In 2022, the total number of actual sales that closed in a particular month is 813 for single-family homes and 1289 for condominiums. These values are lower than the number of closed transactions last year.
- In September 2022 alone, there was a 50.4% reduction from closed sales in September 2021 to September 2022 for single-family homes and a 46.7% drop for condominiums compared to the same month in 2021.
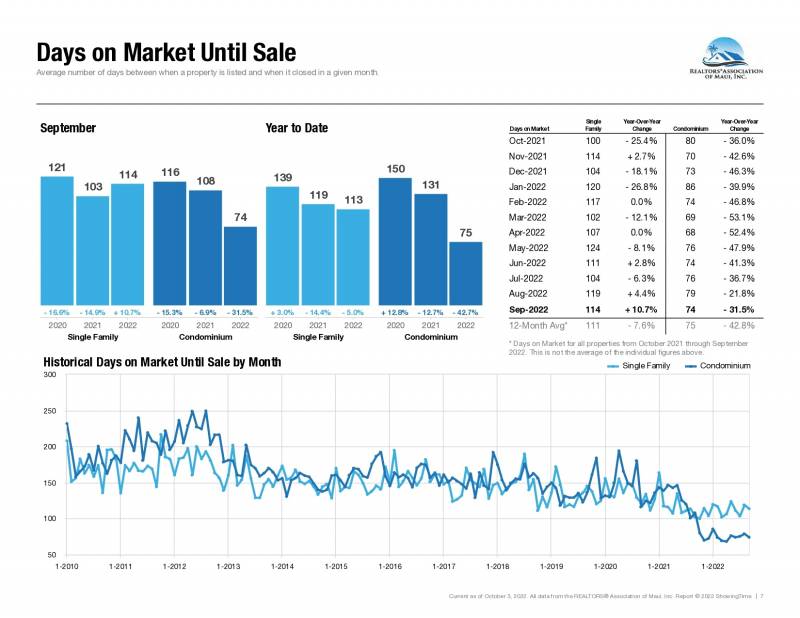
- Year to date, 2022 had the shortest average number of days between when a property is listed and when it closes in a particular month.
- The average days on market till sale for single-family homes in September 2022 was 114 days.
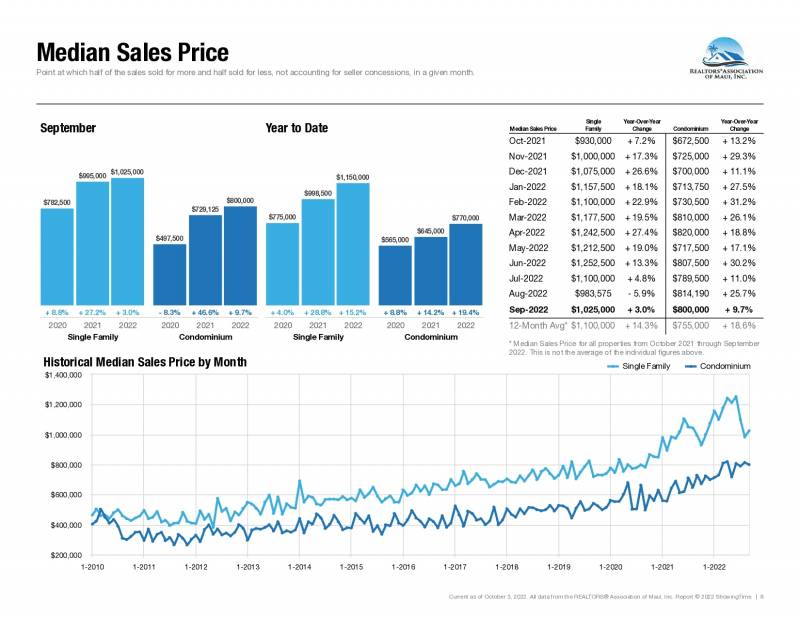
- Compared to the previous two years, 2022 had the highest YTD median sales price of $1,150,000 for single-family homes and $770,000 for condominiums.
- In September alone, the median sales price for single-family homes is $1,025,000 and $800,000 for condominiums, compared to the same month in the previous two years.
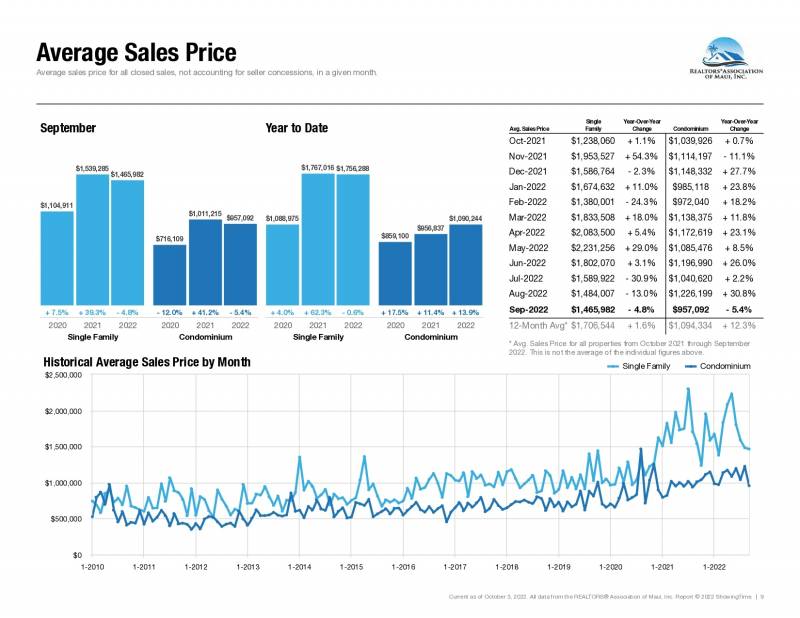
- When it comes to single-family homes, there was nearly no change from 2022 to 2021 in terms of average sales price, dropping by 0.6% in 2022 from 2021 with an ASP of $1,756,288. And it increased significantly for condominiums, from $956,837 in 2021 to $1,090,244 in 2022.
- In September alone, the ASP in 2022 was 4.8% lower than in 2021. The trend for condominiums followed the trend, with a 5.4% decline compared to September 2021.
We have moved past the historical buying spree in 2021 and have entered a new market. Maui is near and dear to my heart and I welcome the opportunity to discuss the market with you. You can find me online at Josh Jerman, R(B) or reach me via email at Josh@HawaiiLife.com or by calling 808.283.2222.

Leave your opinion here. Please be nice. Your Email address will be kept private, this form is secure and we never spam you.