Q3 2022 Reveals Rise in Inventory and Fewer Days on Market Amid a Slight Price Drop, As Market Normalizes, Conditions Still Favor Sellers
Despite a softening in the Maui real estate market, we are still in a Seller’s Market. Maui inventory has increased by more than 23.1% in the last 12 months, while the number of sales decreased -32.6% over the same period. Q3 property sales were 234, -32.6% lower than the 347 sales in Q3 the previous year. Over the past 12 months, there’s been a steady rise in active listings.
Maui Market Statistics Overview
Inventory
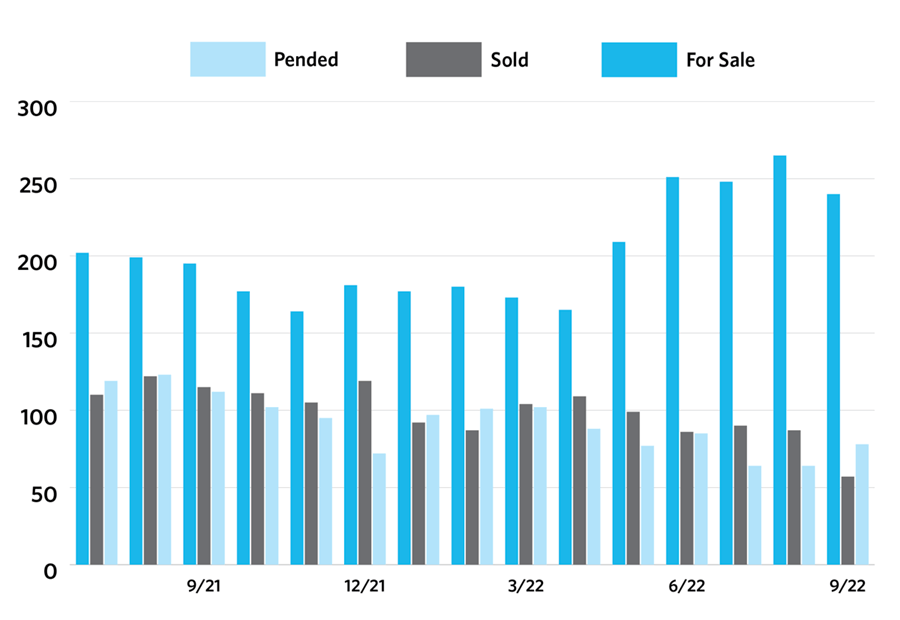
There are currently 240 active residential listings on Maui, an increase of 23.1% comparing Q3 2021 to Q3 2022. Number of single-family homes available for sale continues to increase as inventory experiences upward shift.
There were 234 sales on Maui in Q3 2022, a decrease of -32.6% from 347 sales in Q3 2021.
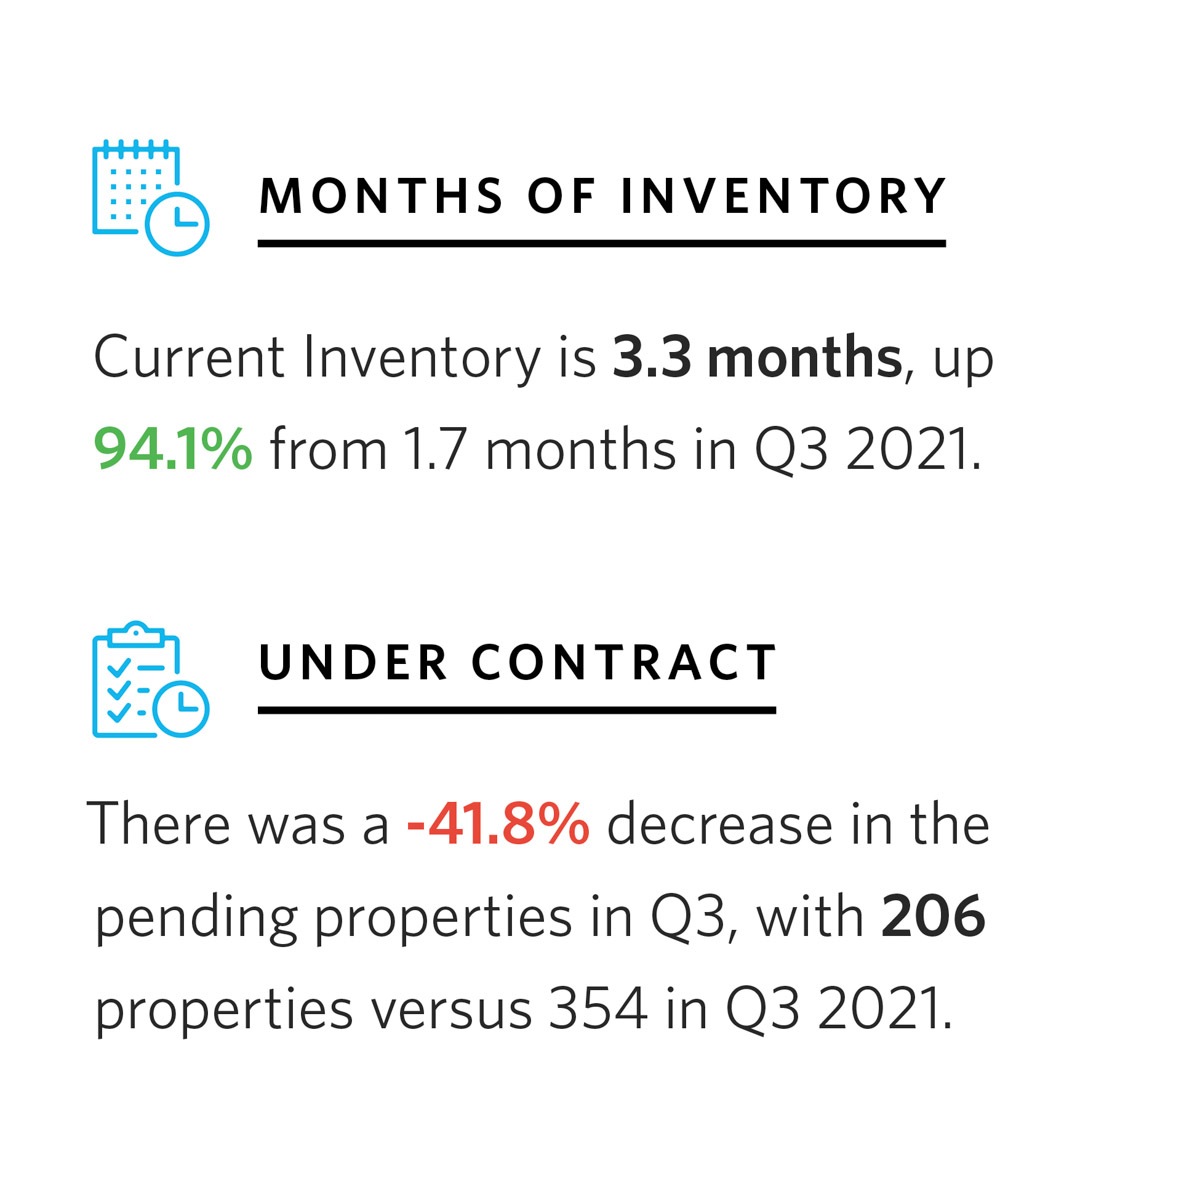
Homes under contract were 206, a decrease of -41.8% over the same period last year, in which 354 homes were under contract in Q3 2021.
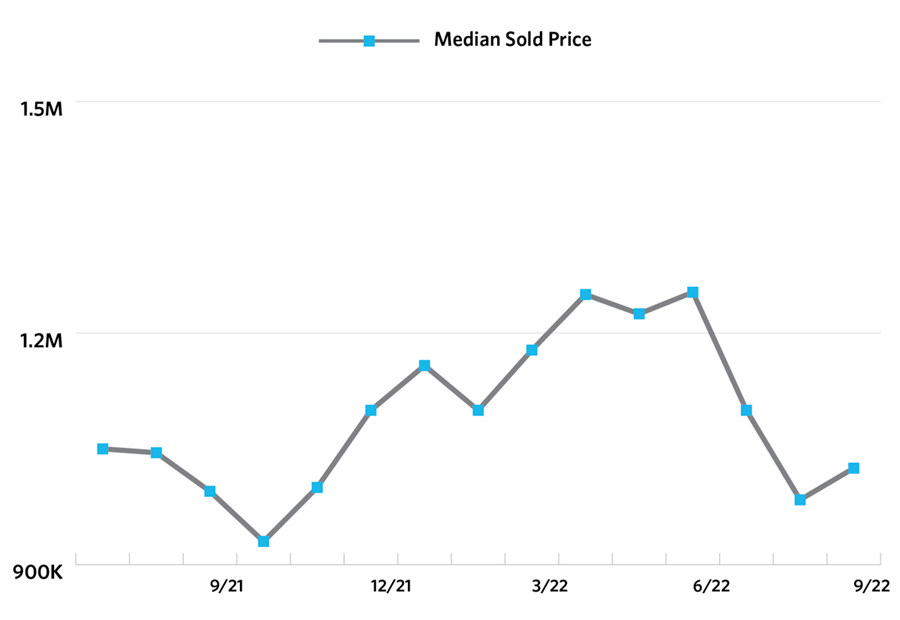
Median Sold Price
For the third quarter of 2022, the median sold price of single-family homes on Maui was $1.025M, a decrease of -1.9% from the median sold price of $1.045M during Q3 2021.
Price of single-family homes sees a subtle drop.
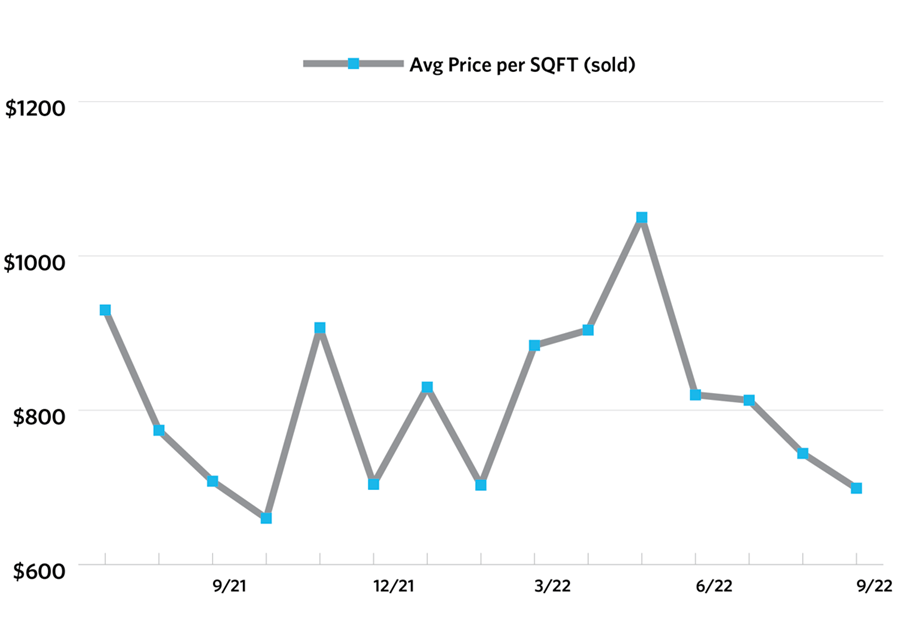
Average Price Per Square Foot
Since Median Sold Price and Average Sold Price can be impacted by the mix of high or low end properties on the market, the Average Sold Price per Square Foot is a more normalized indicator of the direction of property values.
For Maui, the average price per square foot has shown a slight decrease over the last 12 months, with the year-over-year average dropping from $804 to $752, a decline of -6.5% comparing Q3 2021 to Q3 2022.
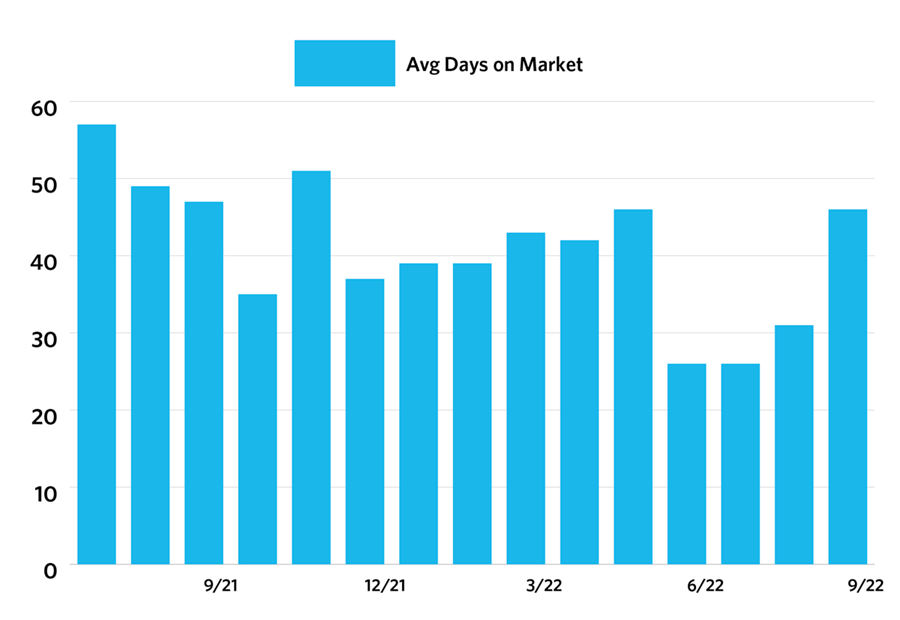
Days on Market
The average Days on Market (DOM) shows how many days the average property is on the market before it sells. The downward trend indicates a move towards more of a Seller’s market. While some of the previous 12 months have been outliers, the overall trendline shows that Days on Market is decreasing. Q3 2022 reported an average number of days on the market as 34 DOM, a decrease of -33.3% compared to 51 DOM Q3 2021.
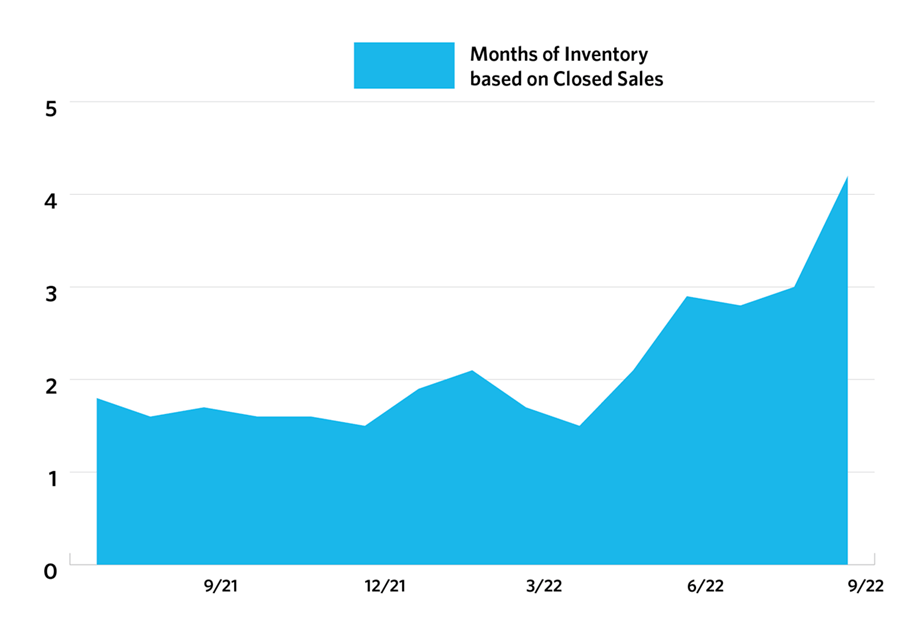
Months of Inventory
Current months of inventory available is 3.3 months, an increase of 94.1% comparing Q3 2022 to 1.7 months in Q3 2021.
The real estate market on Maui is seeing a significant increase in inventory.
Maui Snapshot
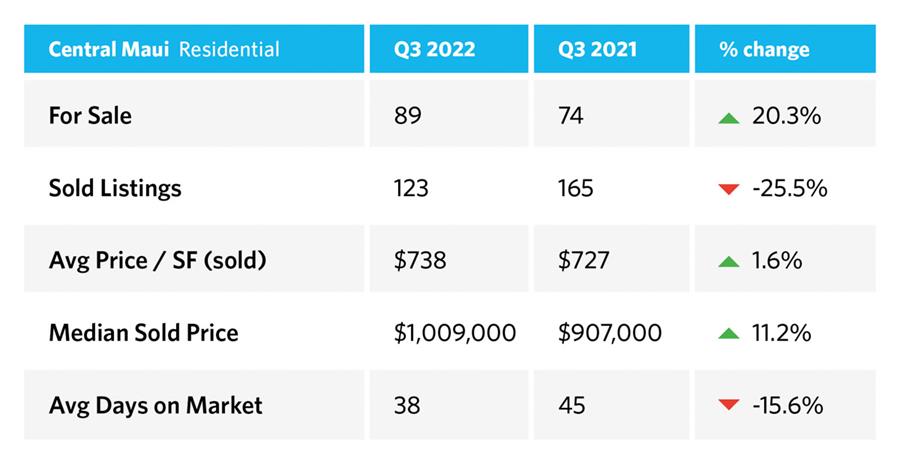
This snapshot gives you an overview of the kind of activity we are seeing in this part of the Island. Contact me for details.


Leave your opinion here. Please be nice. Your Email address will be kept private, this form is secure and we never spam you.