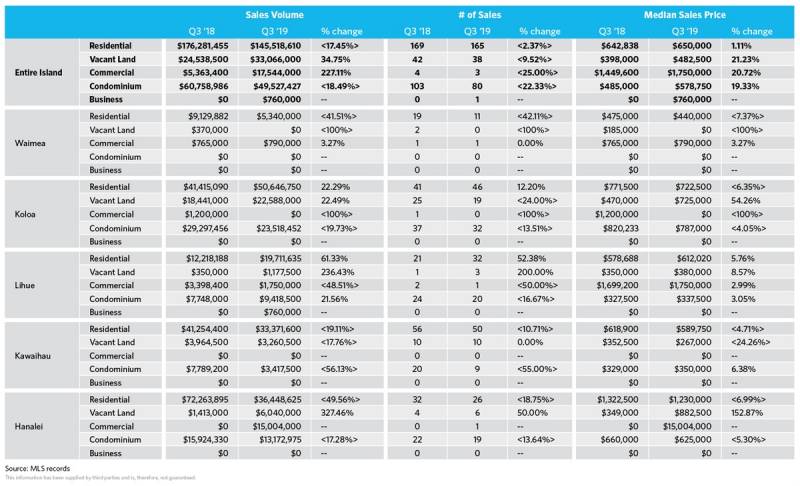
Third quarter data for 2019 yielded some interesting observations. While the third quarter sales volume for the entire island was nearly the same as Q2 2019 (at $145.5M on 165 trades from $148.8M on 176 sales), compared to the third quarter of 2018, island wide residential sales volume was down 17.5%.

Despite this overall decline, several segments outperformed the same quarter last year. In particular, the Koloa District which includes Poipu, saw an increase in sales volume of 22.3% and the Lihue district saw a sales volume increase of 61.3% increasing from $12.2M in 2018 to $19.7M in Q3 2019.
The districts comprising the west side, east side and north shore each saw a decline. Given that the number of trades is close to on par (169 in Q3 ’18 versus 165 in Q3 ’19), much of the sales volume decline can be attributed to fewer large volume transactions during the quarter. Despite this however, median prices are similar to last year; island wide median residential prices increased from $643K in Q3 ’18 to $650K in Q3 ’19, and on the north shore, residential median prices moved from $1.32M in Q3 ’18 to $1.23M in Q3′ 19.
North Shore
Within the North Shore market segment, residential sales volume did show 2018 numbers, falling sharply from the $72.3M in sales volume during the period in 2018 to $36.4M this period. Similar to the islandwide trend, however, Q3 ’19 numbers tracked those of last quarter where volume totaled $36.3M.
If you’d like to explore the numbers a bit deeper, check out the market snapshot below or via this link for an enlarged version.
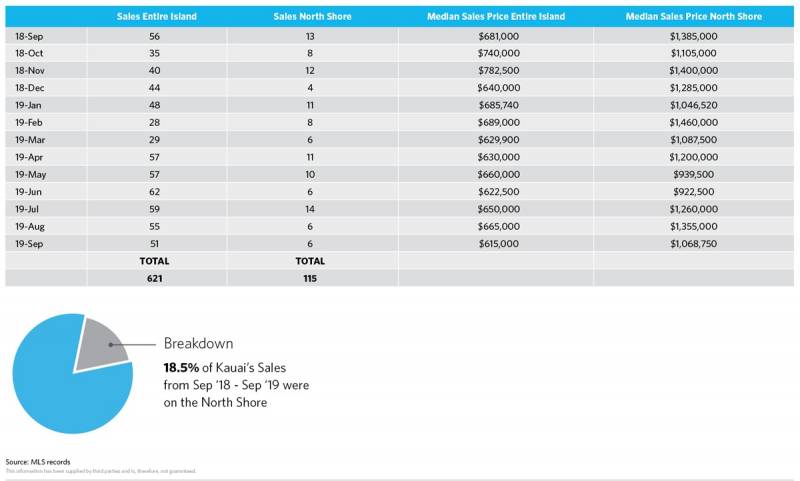
Monthly Sales and Median Price Statistics
The monthly residential sales chart below shows some tapering in the island wide number of sales that picked up in the second quarter but is still quite strong overall. July (for the North Shore) had the most number of residential closings so far this year at 14 for the month. Median prices for residential properties, both island wide and for the North Shore, continue to fluctuate around what has been a steady, strong and consistent value over the past year.
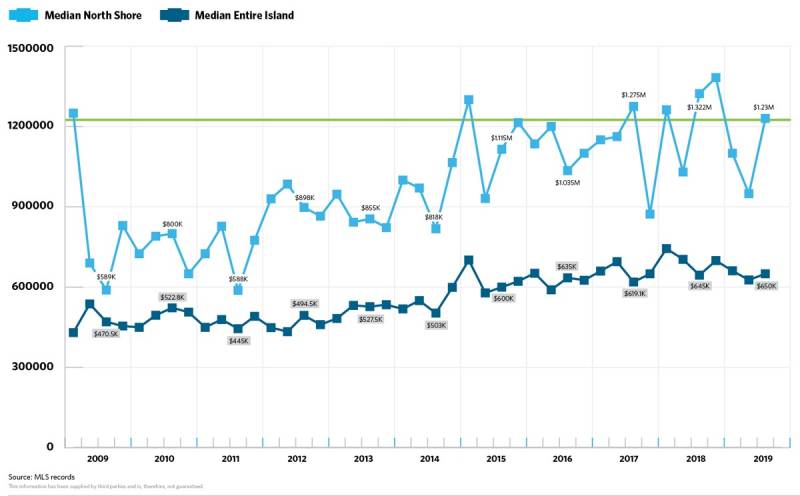
Quarterly Median Sales Prices
The chart below gives another great illustration of a leveling in median prices. Both plots below depict a clearly increasing trend between 2010 and 2018 and a leveling off between 2018 and our most current data point.

Leave your opinion here. Please be nice. Your Email address will be kept private, this form is secure and we never spam you.