Kapalua Bay Villas: Market Inventory High, Sales on Pace with 2018
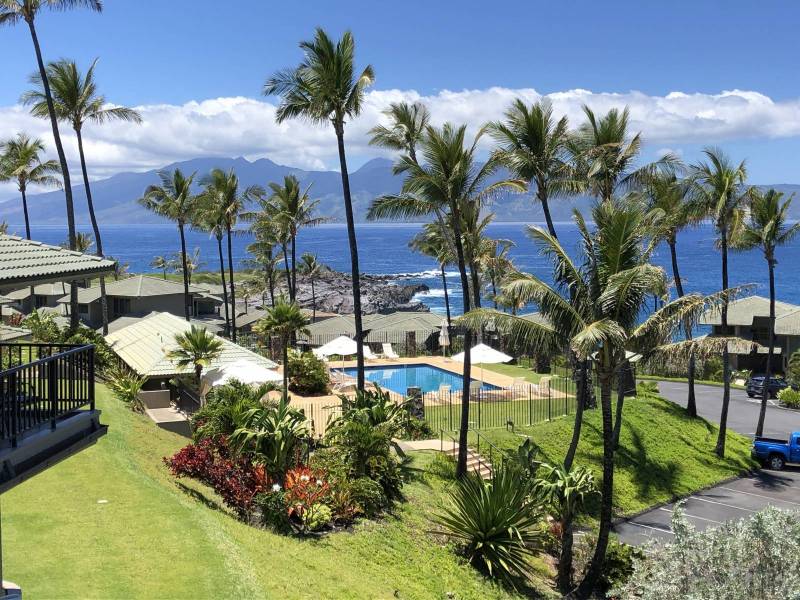
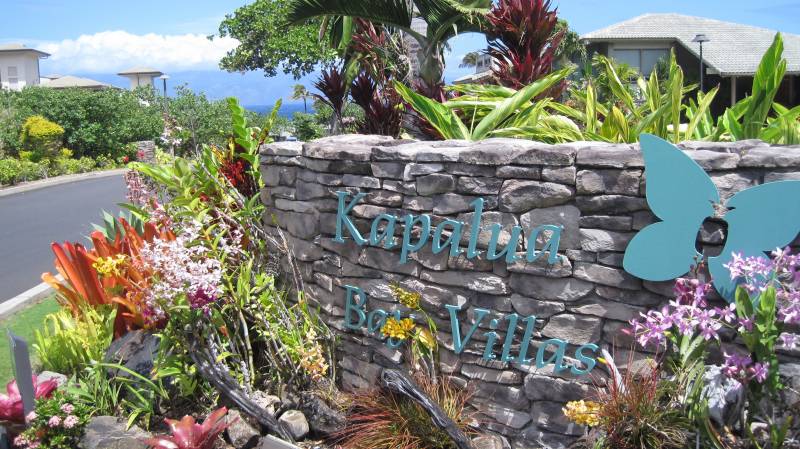
As part of my commitment to keeping the community informed about West Maui’s resort laden, micro-market real estate environment, I’m bringing you an up-to-date, comprehensive property market summary of the Kapalua Bay Villas, Kapalua’s premier beachfront condo community.
What You’ll Find
- Actual Sales Prices: learn exactly how much specific properties sold for
- Sales Volume: see the strength of the market in terms of how many properties sold
- Days on Market: understand how long it takes the average property to sell
- List Price vs. Sold Price: see how the final sales price compares to the listing price
- Price Per Square Foot: which is critical in calculating real estate values
- Asset % Growth: what is the yr over year appreciation if my property
- Current Inventory: what is actively for sale and currently under contract
Before we dig into the numbers, make sure you subscribe to my blog if you want to be notified of future market reports as they come available.
Neighborhood Snapshot
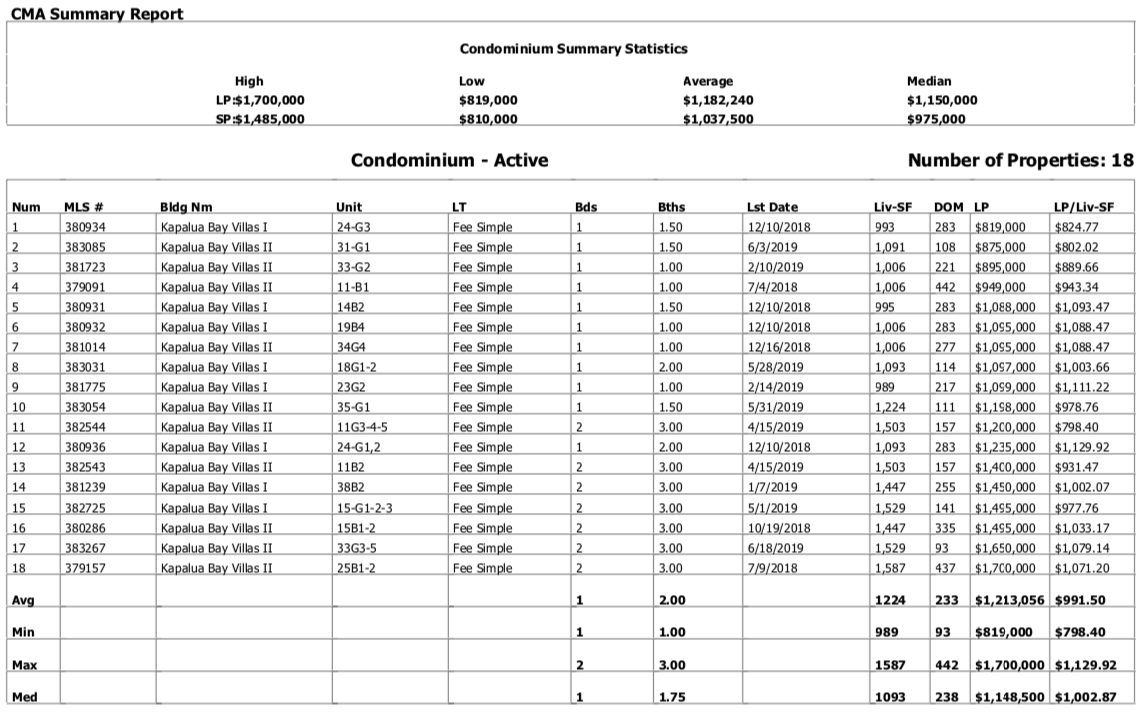
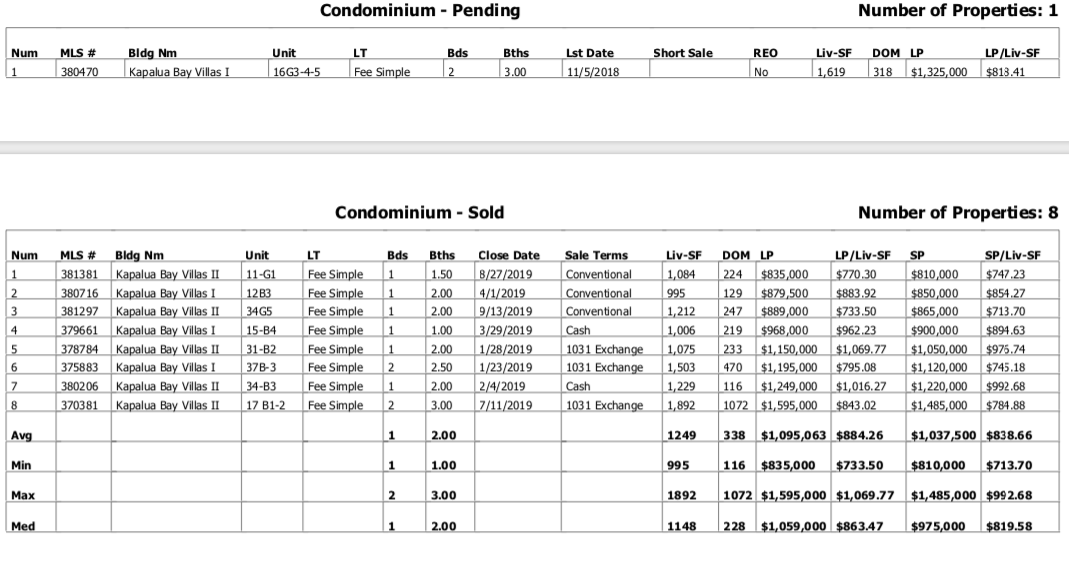
- There have been 7 Bay Villa sales this year, and with one under contract it is looking for certain KBV will improve on the 7 transactions all of last year. From a price standpoint: The $966K 1-bedroom average sales price is a 3% increase over last year. However, 2-bedrooms are down 11% with an average sales price of $1.302M in 2019.
- Days on Market from time of listing to closing is averaging 352 days for 2019
- Currently, there are 18 actively listed units for sale and 1 under contract (roughly 2 1/2 years of available inventory)
KBV Historical Sales Summary (click on the images/links for interactive)
| Year | Avg List Price | Avg Sold Price | List Sell | Yr Gr | DOM | # Sold |
| 2019 | $1,124,500 | $1,062,143 | 94% | -2% | 352 | 8 |
| 2018 | $1,143,714 | $1,088,750 | 95% | 2% | 258 | 7 |
| 2017 | $1,152,182 | $1,068,982 | 93% | 5% | 369 | 11 |
| 2016 | $1,119,000 | $1,016,798 | 91% | -3% | 319 | 8 |
| 2015 | $1,161,667 | $1,051,667 | 91% | -9% | 542 | 3 |
| 2014 | $1,249,667 | $1,154,417 | 92% | 0% | 430 | 6 |
Bedroom Bathroom Breakdown
| 1 Bedroom | ||||||
| Year | Avg List Price | Avg Sold Price | List Sell | Yr Gr | DOM | # Sold |
| 2019 | $1,016,300 | $966,000 | 95% | 3% | 184 | 5 |
| 2018 | $1,002,200 | $934,250 | 93% | 1% | 311 | 5 |
| 2017 | $974,250 | $922,975 | 95% | 14% | 196 | 8 |
| 2016 | $873,400 | $806,877 | 92% | -7% | 270 | 5 |
| 2015 | $895,000 | $870,000 | 97% | -12% | 312 | 1 |
| 2014 | $1,074,750 | $987,875 | 92% | 1% | 419 | 4 |
| 2 Bedroom | ||||||
| Year | Avg List Price | Avg Sold Price | List Sell | Yr Gr | DOM | # Sold |
| 2019 | $1,395,000 | $1,302,500 | 93% | -11.7% | 771 | 2 |
| 2018 | $1,497,500 | $1,475,000 | 98% | 1.1% | 125 | 2 |
| 2017 | $1,626,666 | $1,458,333 | 90% | 6.7% | 832 | 3 |
| 2016 | $1,528,333 | $1,366,667 | 89% | 6.4% | 402 | 3 |
| 2015 | $1,395,000 | $1,285,000 | 92% | -13.6% | 1103 | 1 |
| 2014 | $1,599,500 | $1,487,500 | 93% | 15.5% | 452 | 2 |
2019 Sales & Active Market
 Want to Know More?
If you are in the market for buying or selling Kapalua real estate or have any questions about the area or the market in general, please feel free to contact me. I welcome the opportunity to give you information on my previous sales performance and marketing strategies. Or if you’re curious about what your property is worth in today’s market, it would be my pleasure to provide you with property information and a value assessment free of any sales pitch.

Leave your opinion here. Please be nice. Your Email address will be kept private, this form is secure and we never spam you.