Kaanapali Hillside | Prices Dip, Still At Top Of Buyer Desirability
As part of my commitment to keeping the community informed about West Maui’s resort laden micro-market real estate environment, I’m bringing you an up-to-date, comprehensive property market summary of the Kaanapali Hillside, the Westside’s premier residential hillside community.
What You’ll Find
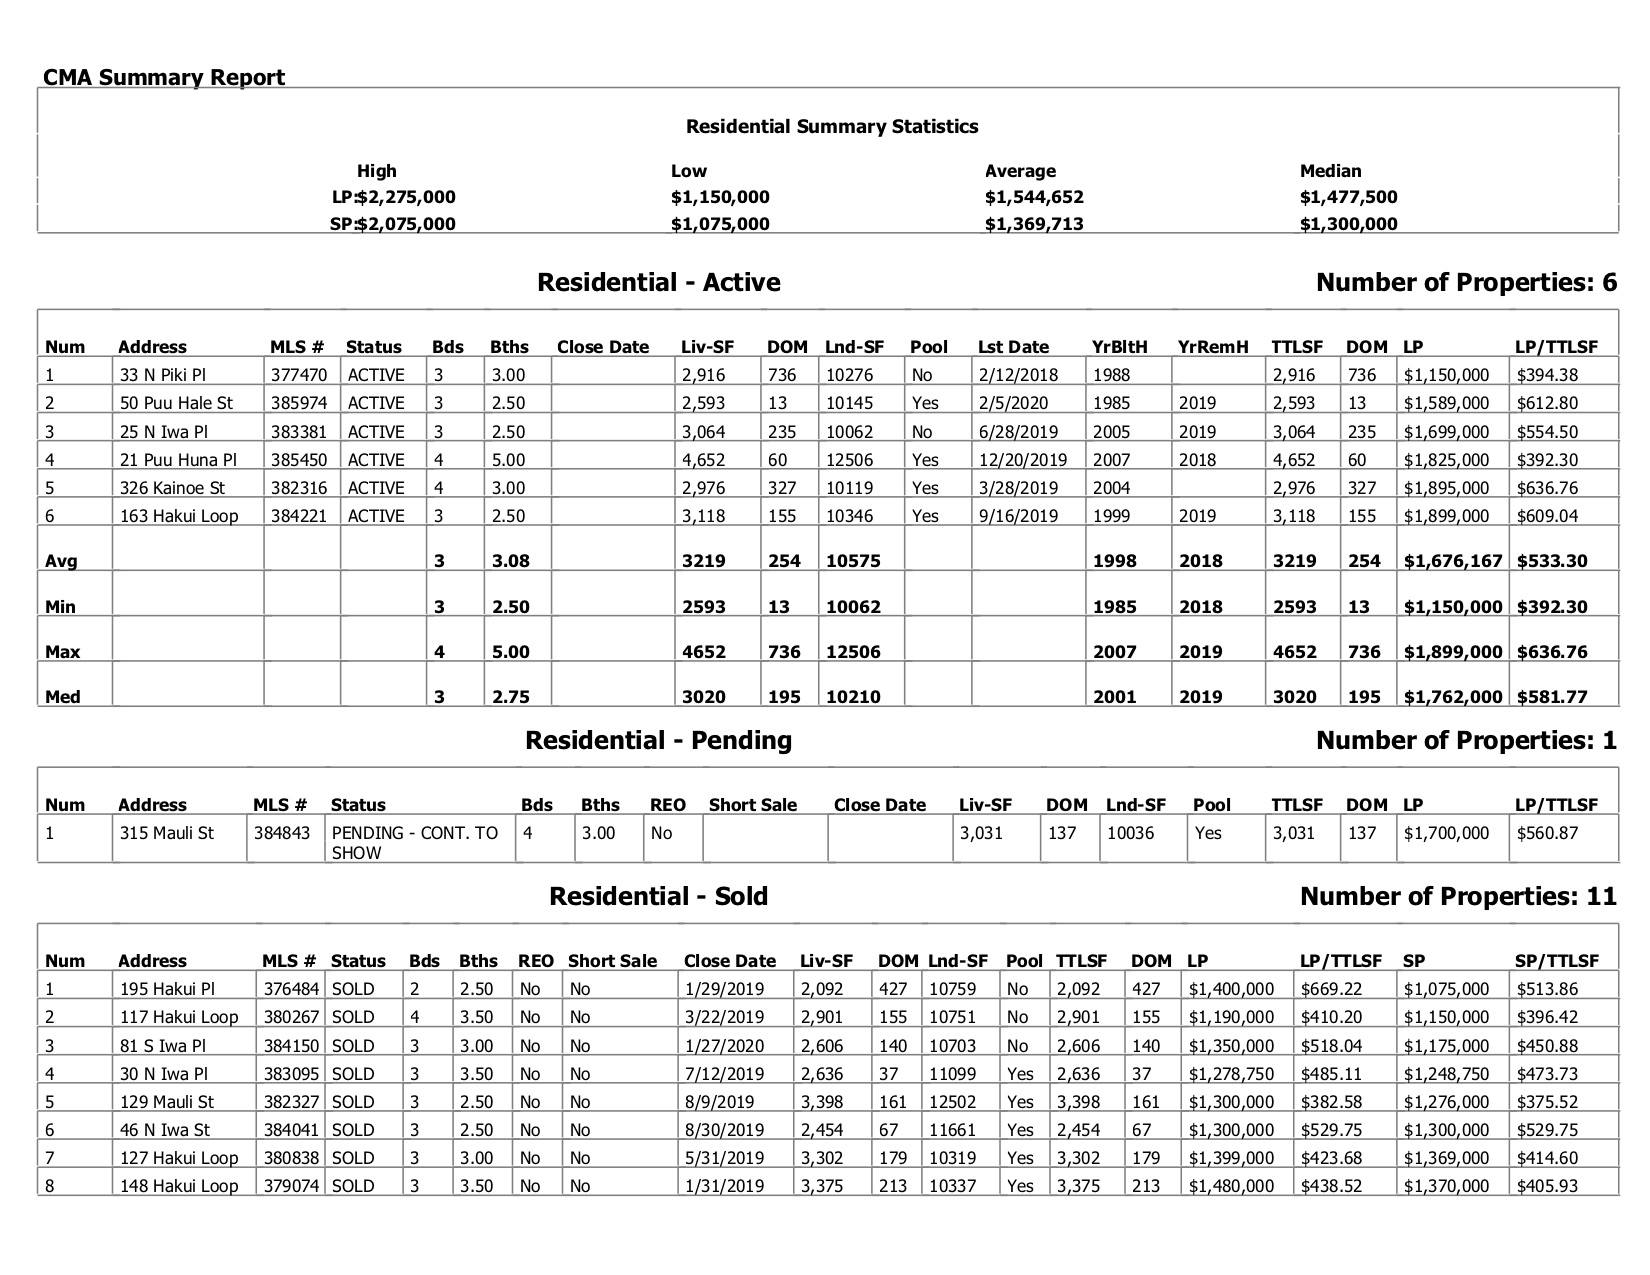
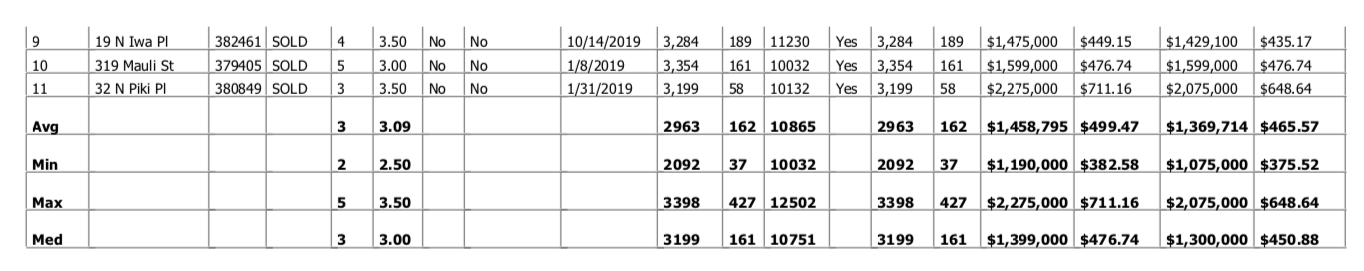
- Actual Sales Prices: learn exactly how much specific properties sold for
- Sales Volume: see the strength of the market in terms of how many properties sold
- Days on Market: understand how long it takes the average property to sell
- List Price vs. Sold Price: see how the final sales price compares to the listing price
- Price Per Square Foot: which is critical in calculating real estate values
- Asset % Growth: what is the year over year appreciation of my property
- Current Inventory: what is actively for sale and currently under contract
Before we dig into the numbers, make sure you subscribe to my blog if you want to be notified of future market reports as they come available.
Kaanapali Hillside 2019/2020 | Market Headlines
- The new year 2020 has already seen 1 property sell and 1 other go under contract
- Currently 7 properties remain actively listed for sale ranging from $1.15M – $1.9M
- 2019 saw a decline in average sales price by 8%. However, take into account 2018 was the highest average sales price the Kaanapali Hillside has seen since 2007 when the avg sales price was $1.685M. The all-time high for avg sales price was 2006 ($1.77M).
- Pricing didn’t necessarily affect volume with 10 properties trading hands, keeping KH at the top of Buyer desirability. Historically (since 1996), approximately 10 properties sell per year.
- While sales prices have declined a bit, the positive trade off appears to also be the significant decline in days on market. Whether this is price driven, or just attractive inventory, the result is a 60 fewer days market time for sellers in 2019 and the lowest since 2013 when the avg sale price was $1.1M.
- Currently, there are 7 actively listed units for sale and 2 under contract.
Sales Sales & More Sales Data
Kaanapali Hillside Historical Sales Summary
| Year | Avg List Price | Avg Sold Price | % List Sell | % Yr Gr | $/Sq Ft | DOM | # Sold |
| 2019 | $1,469,675 | $1,389,185 | 95% | -9.9% | $467 | 165 | 10 |
| 2018 | $1,506,556 | $1,542,125 | 102% | 15.2% | $460 | 229 | 13 |
| 2017 | $1,404,750 | $1,339,031 | 95% | -0.1% | $418 | 286 | 8 |
| 2016 | $1,396,082 | $1,340,052 | 96% | -8.3% | $378 | 312 | 11 |
| 2015 | $1,590,857 | $1,460,714 | 92% | 2.5% | $428 | 197 | 7 |
| 2014 | $1,632,400 | $1,424,500 | 87% | 31.4% | $394 | 222 | 10 |
Kaanapali Hillside Real Estate Comparative Market Analysis
Want to Know More?
If you are in the market for buying or selling Kaanapali real estate or have any questions about the area or the market in general, please feel free to contact me. I welcome the opportunity to give you information on my previous sales performance and marketing strategies. Or if you’re curious about what your property is worth in today’s market, it would be my pleasure to provide you with property information and a value assessment free of any sales pitch.

Leave your opinion here. Please be nice. Your Email address will be kept private, this form is secure and we never spam you.