Big Trades | West Maui Residential Prices Remain Impressively Strong
As it is my commitment to keeping the local community informed, I am pleased to share with you the most recent West Maui home, land, and condo sales reports for your review — covering Kaanapali, Kapalua, Lahaina, and Launiupoko. You’ll find real estate sales volume, days on market, list versus sold price, price per square foot, and significantly more.

West Maui October 2020 Headlines
For further details on any of the statements below, please refer to the sales reports.
-
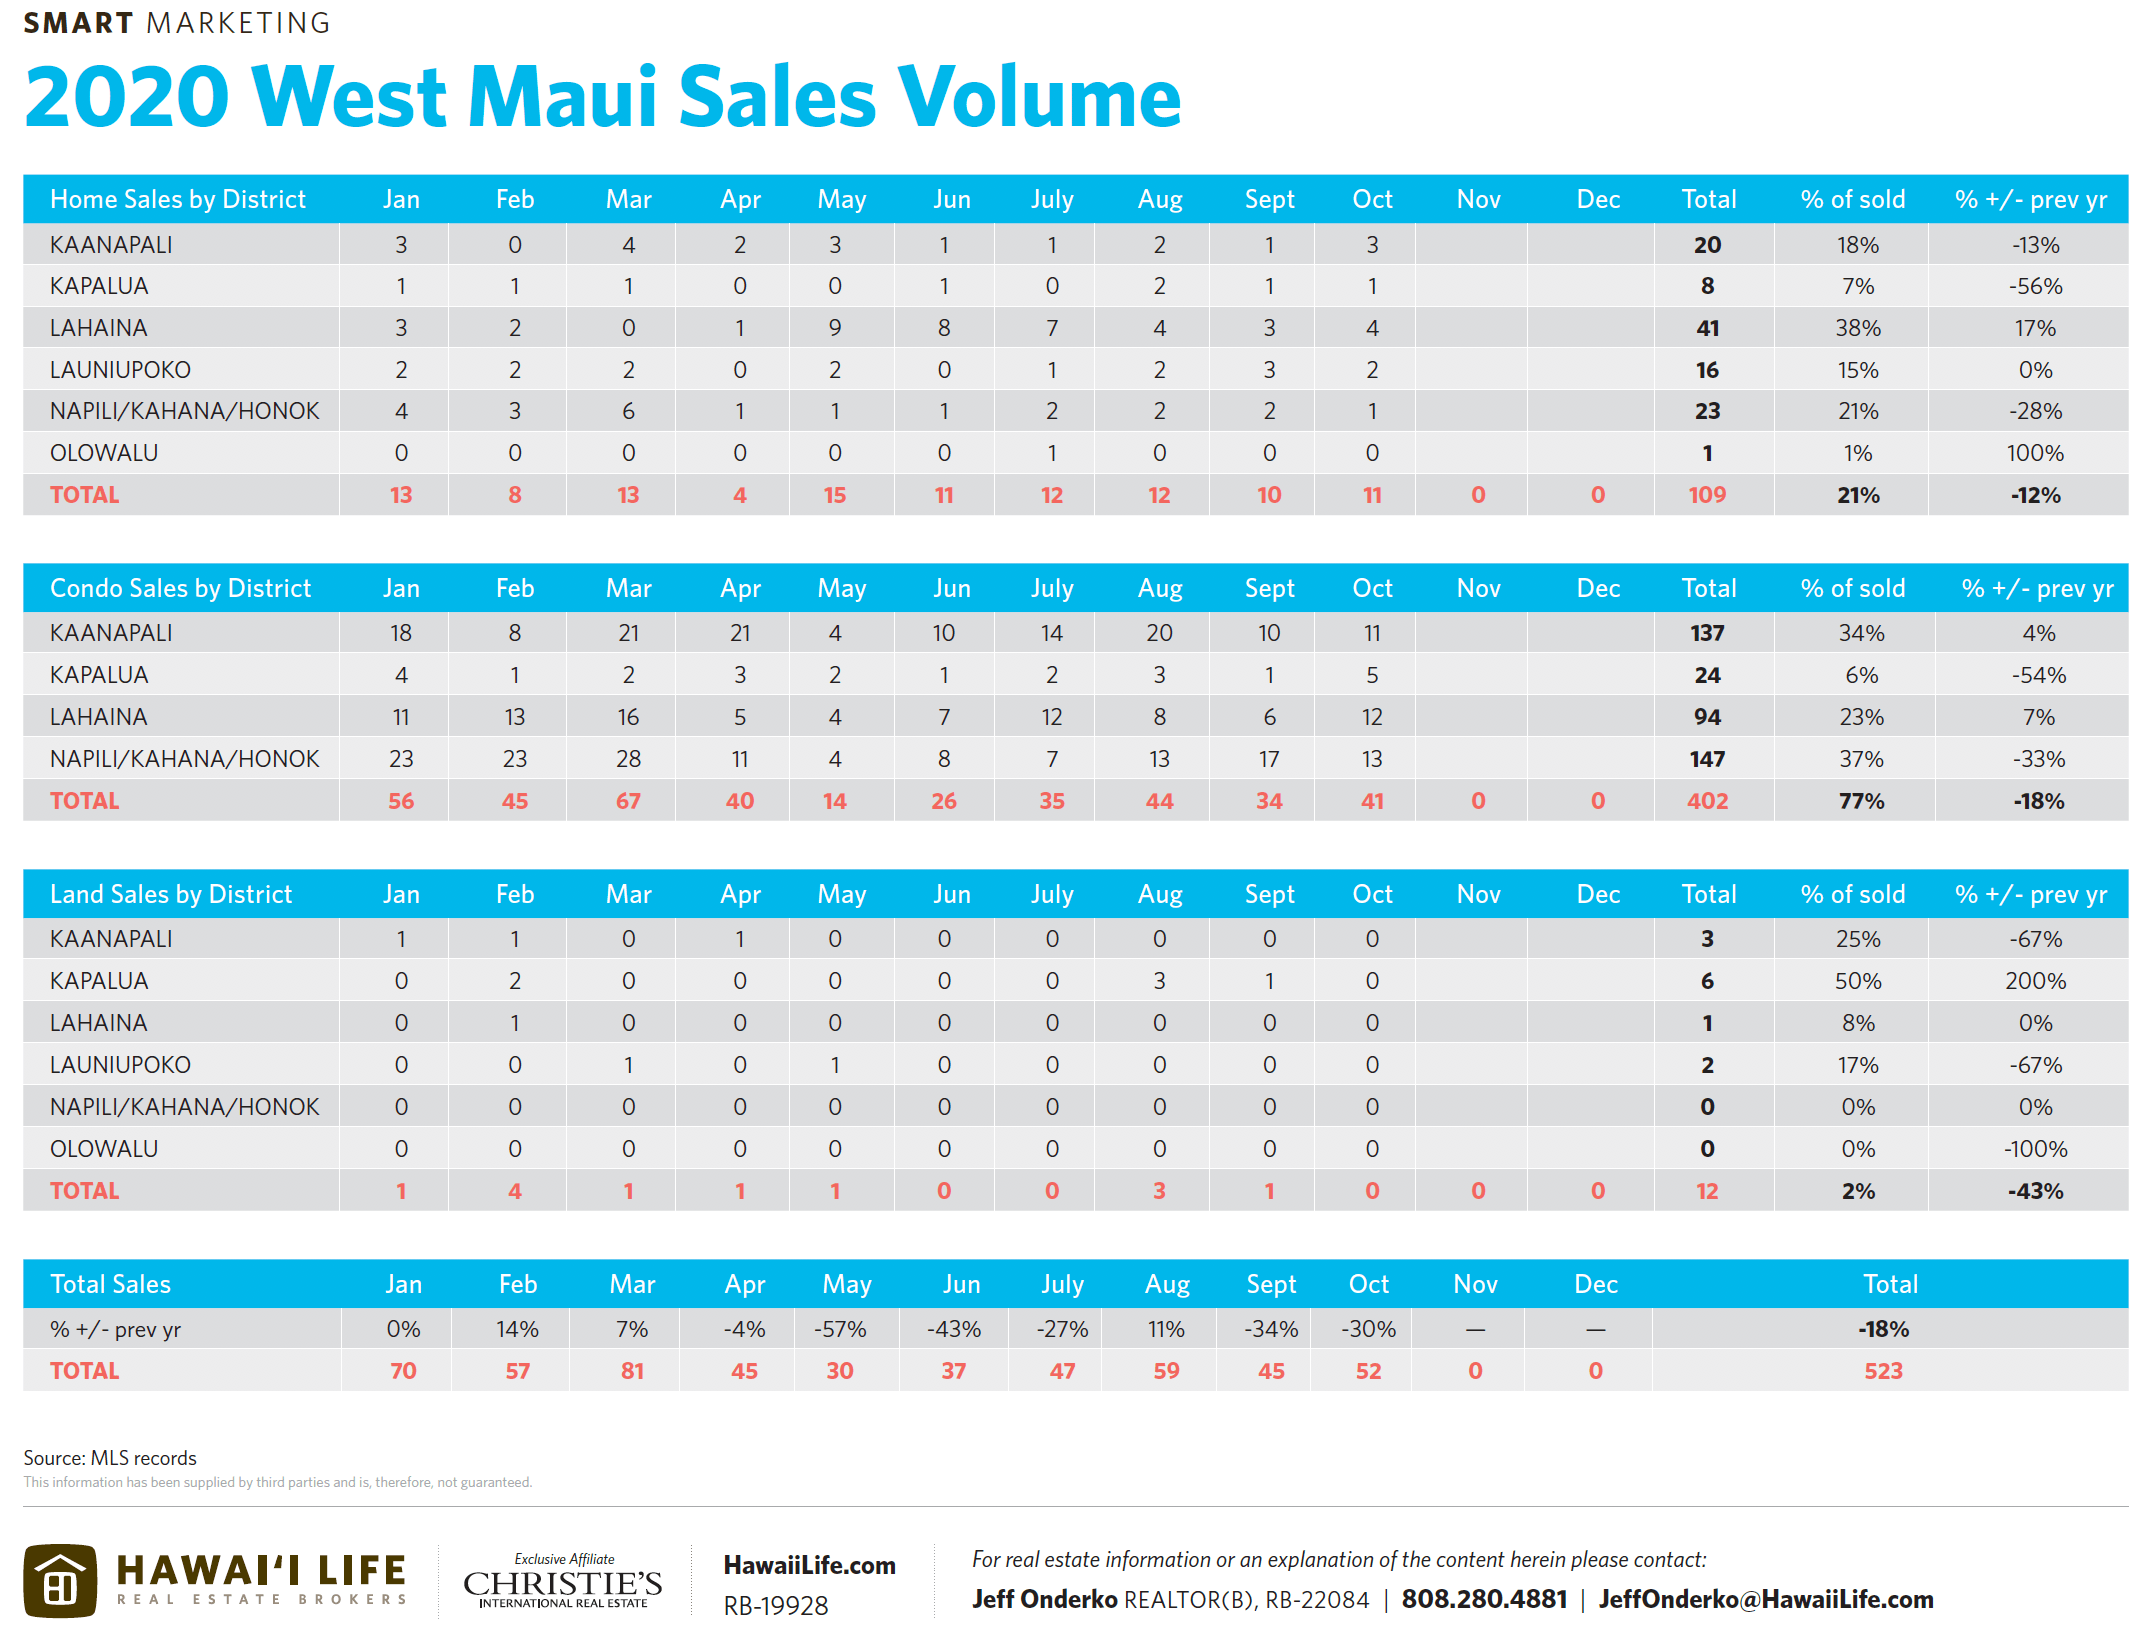
52 Total Transactions
- 11 home, 41 condo & 0 land sales
- 2nd most since March 2020 | However, (-30%) since same period 2019
- 20% of October’s closings were from Lahaina’s new development Kahoma Village
- Predominantly pre-sold in 2018/2019
-
Kaanapali & Lahaina Condo markets are the only sectors that have had any volume growth so far in 2020.
-
Residential Home prices remain impressively strong
- West Maui did the equivalent in baseball of hitting for the cycle with a $1.9M, a $2M, a $3M $a 4.7M & a $15.5M sale
-
If we remove the mentioned Kahoma Village new development sales, then WM average home prices would have been well over $2M
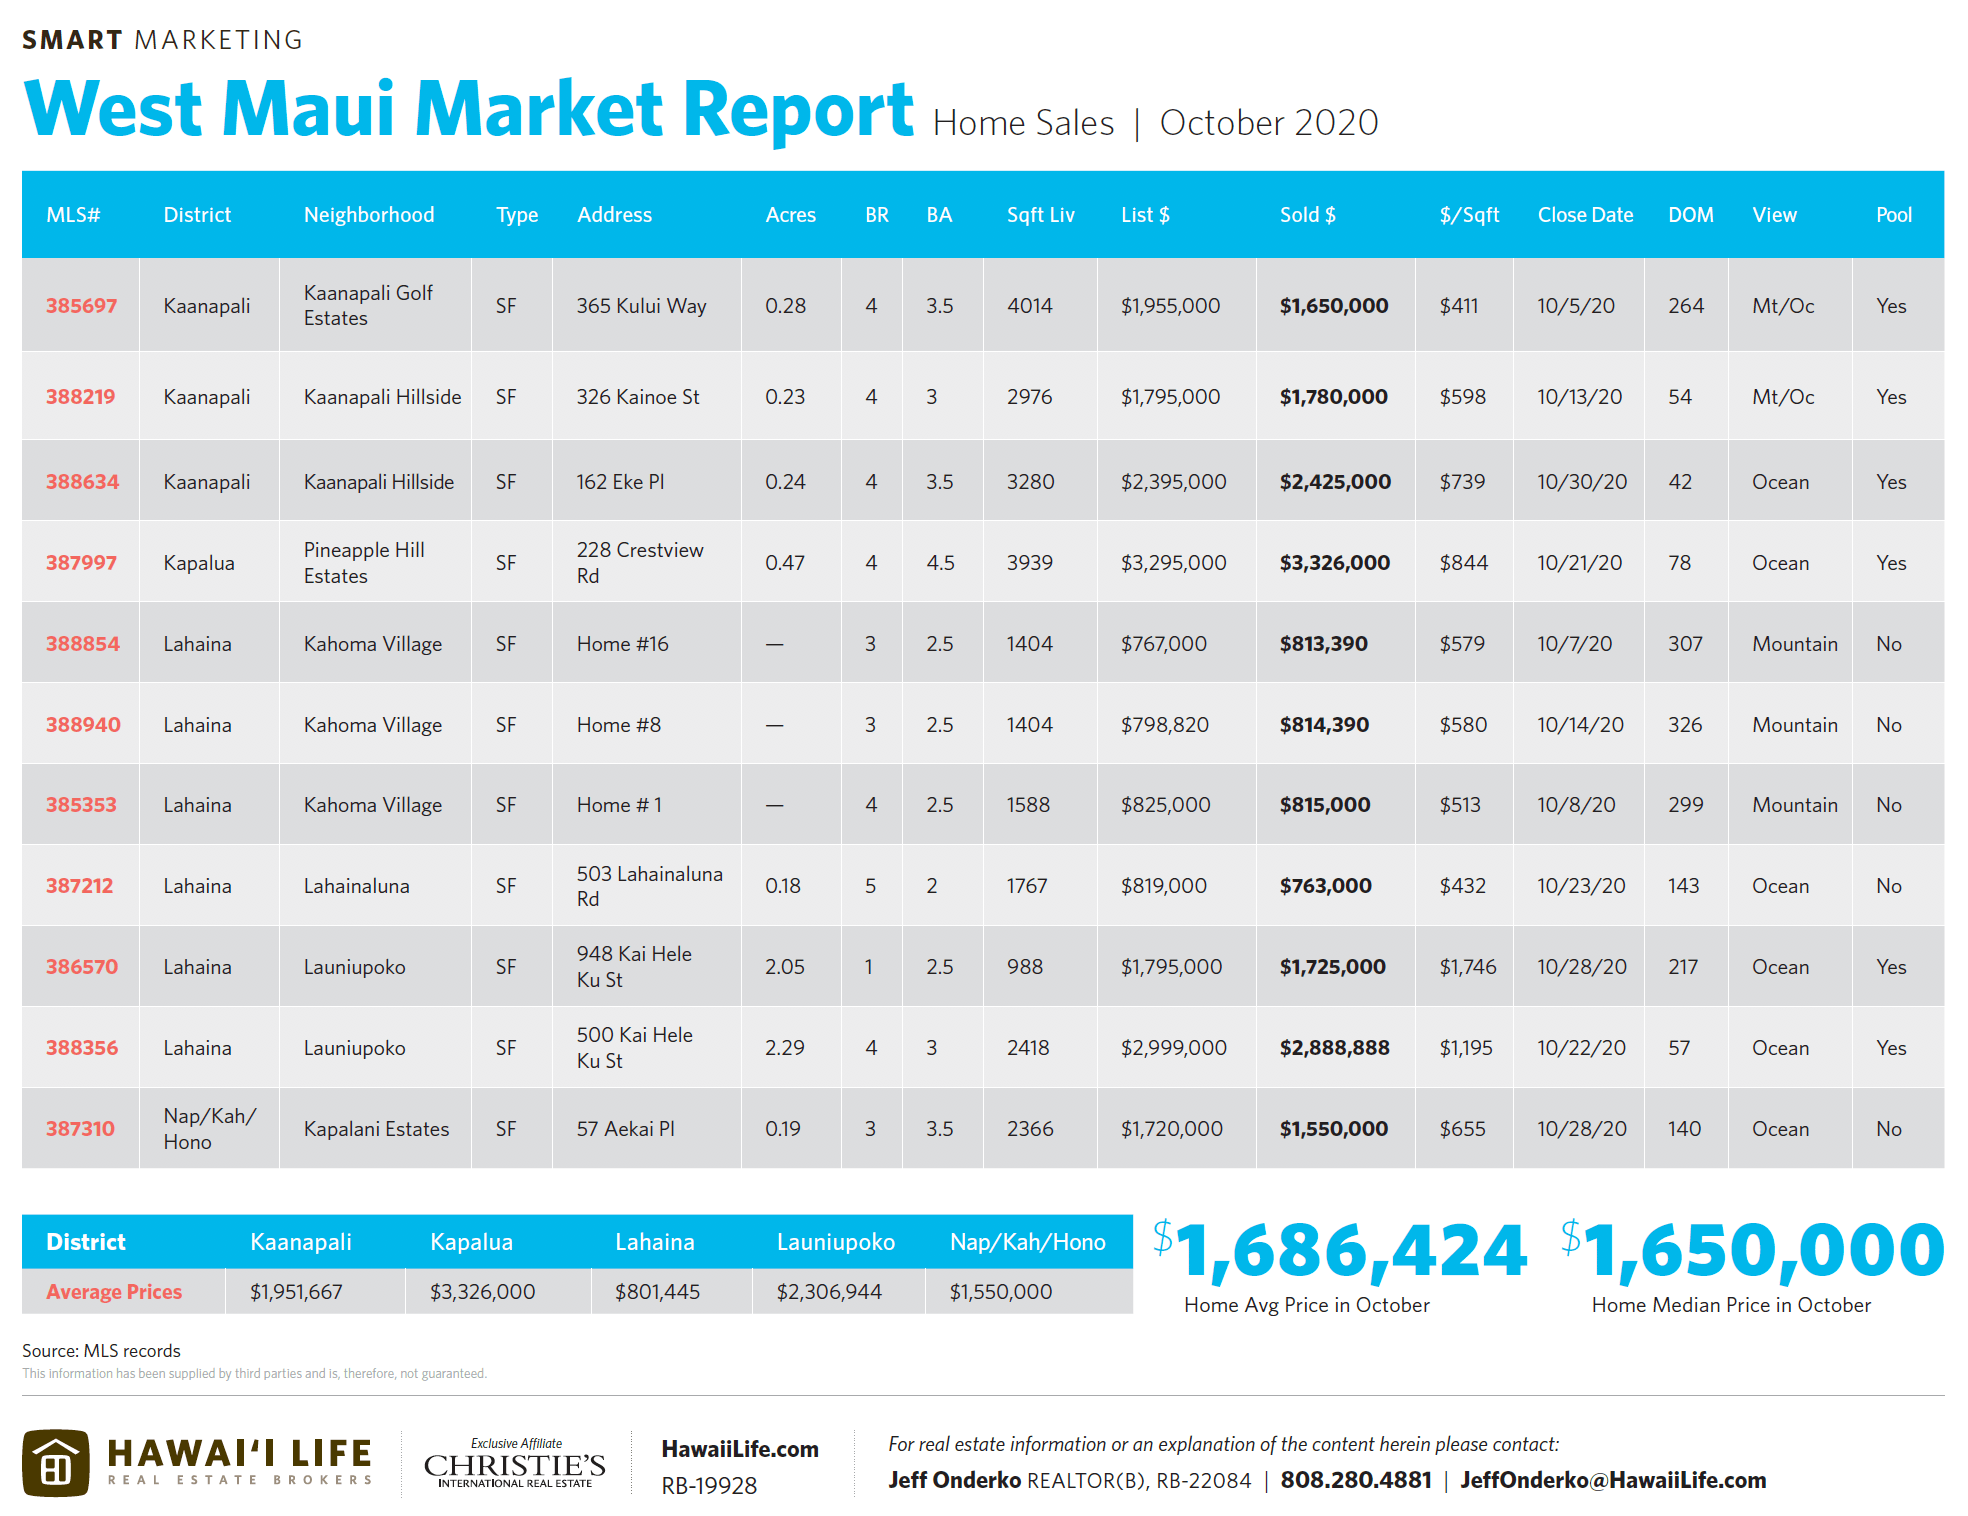
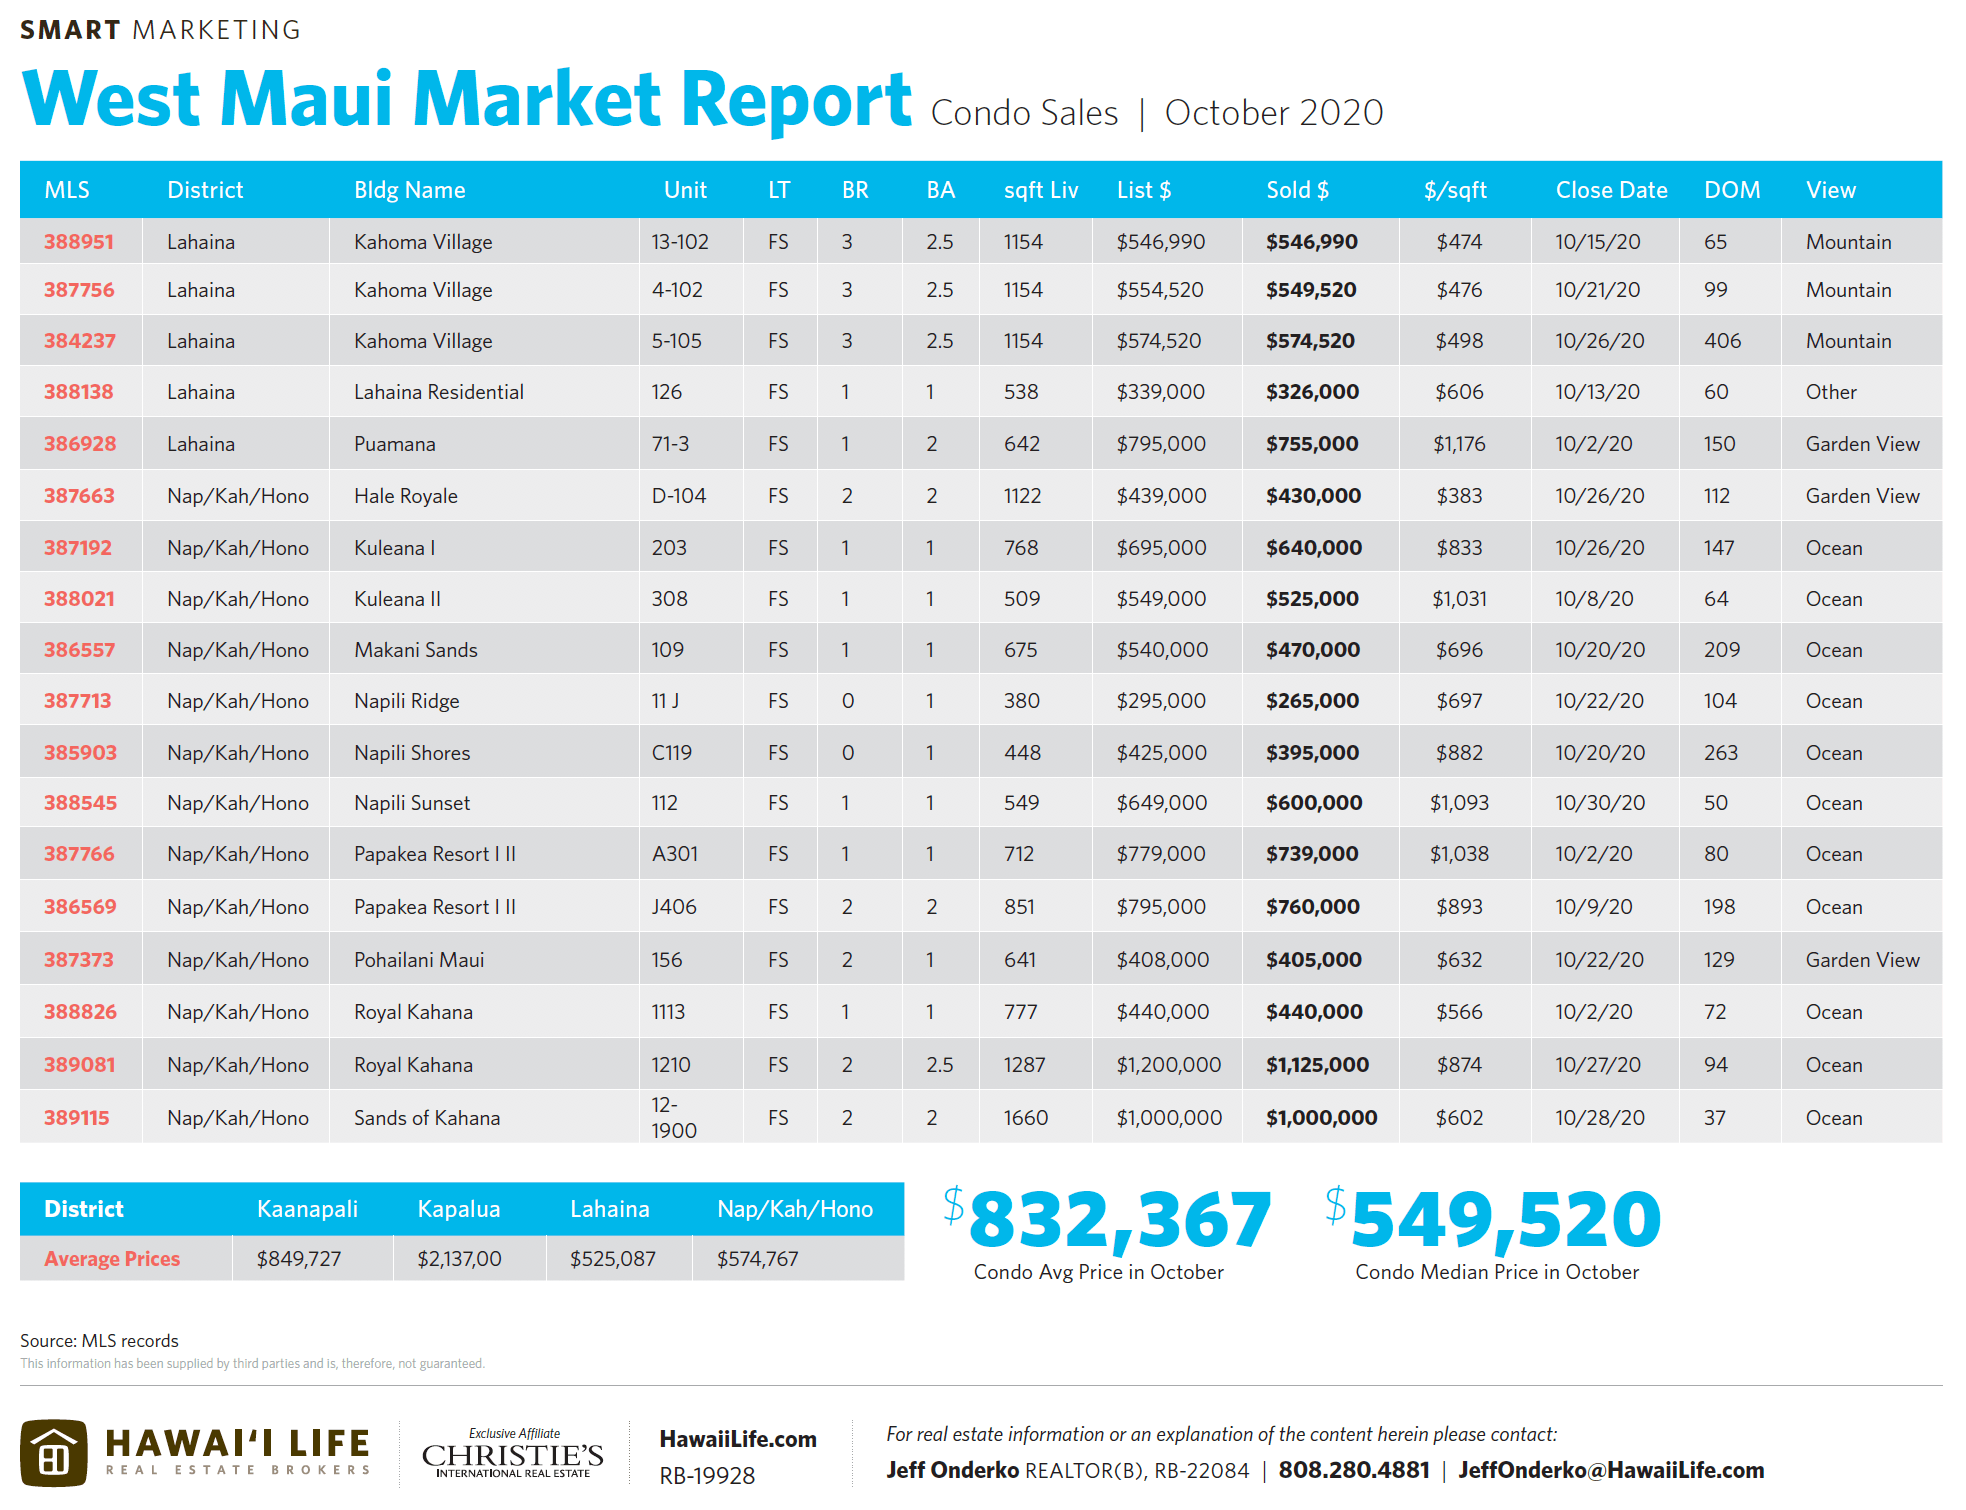
- Median Sales Prices
- Homes: October $1.65M vs. September $1.485M
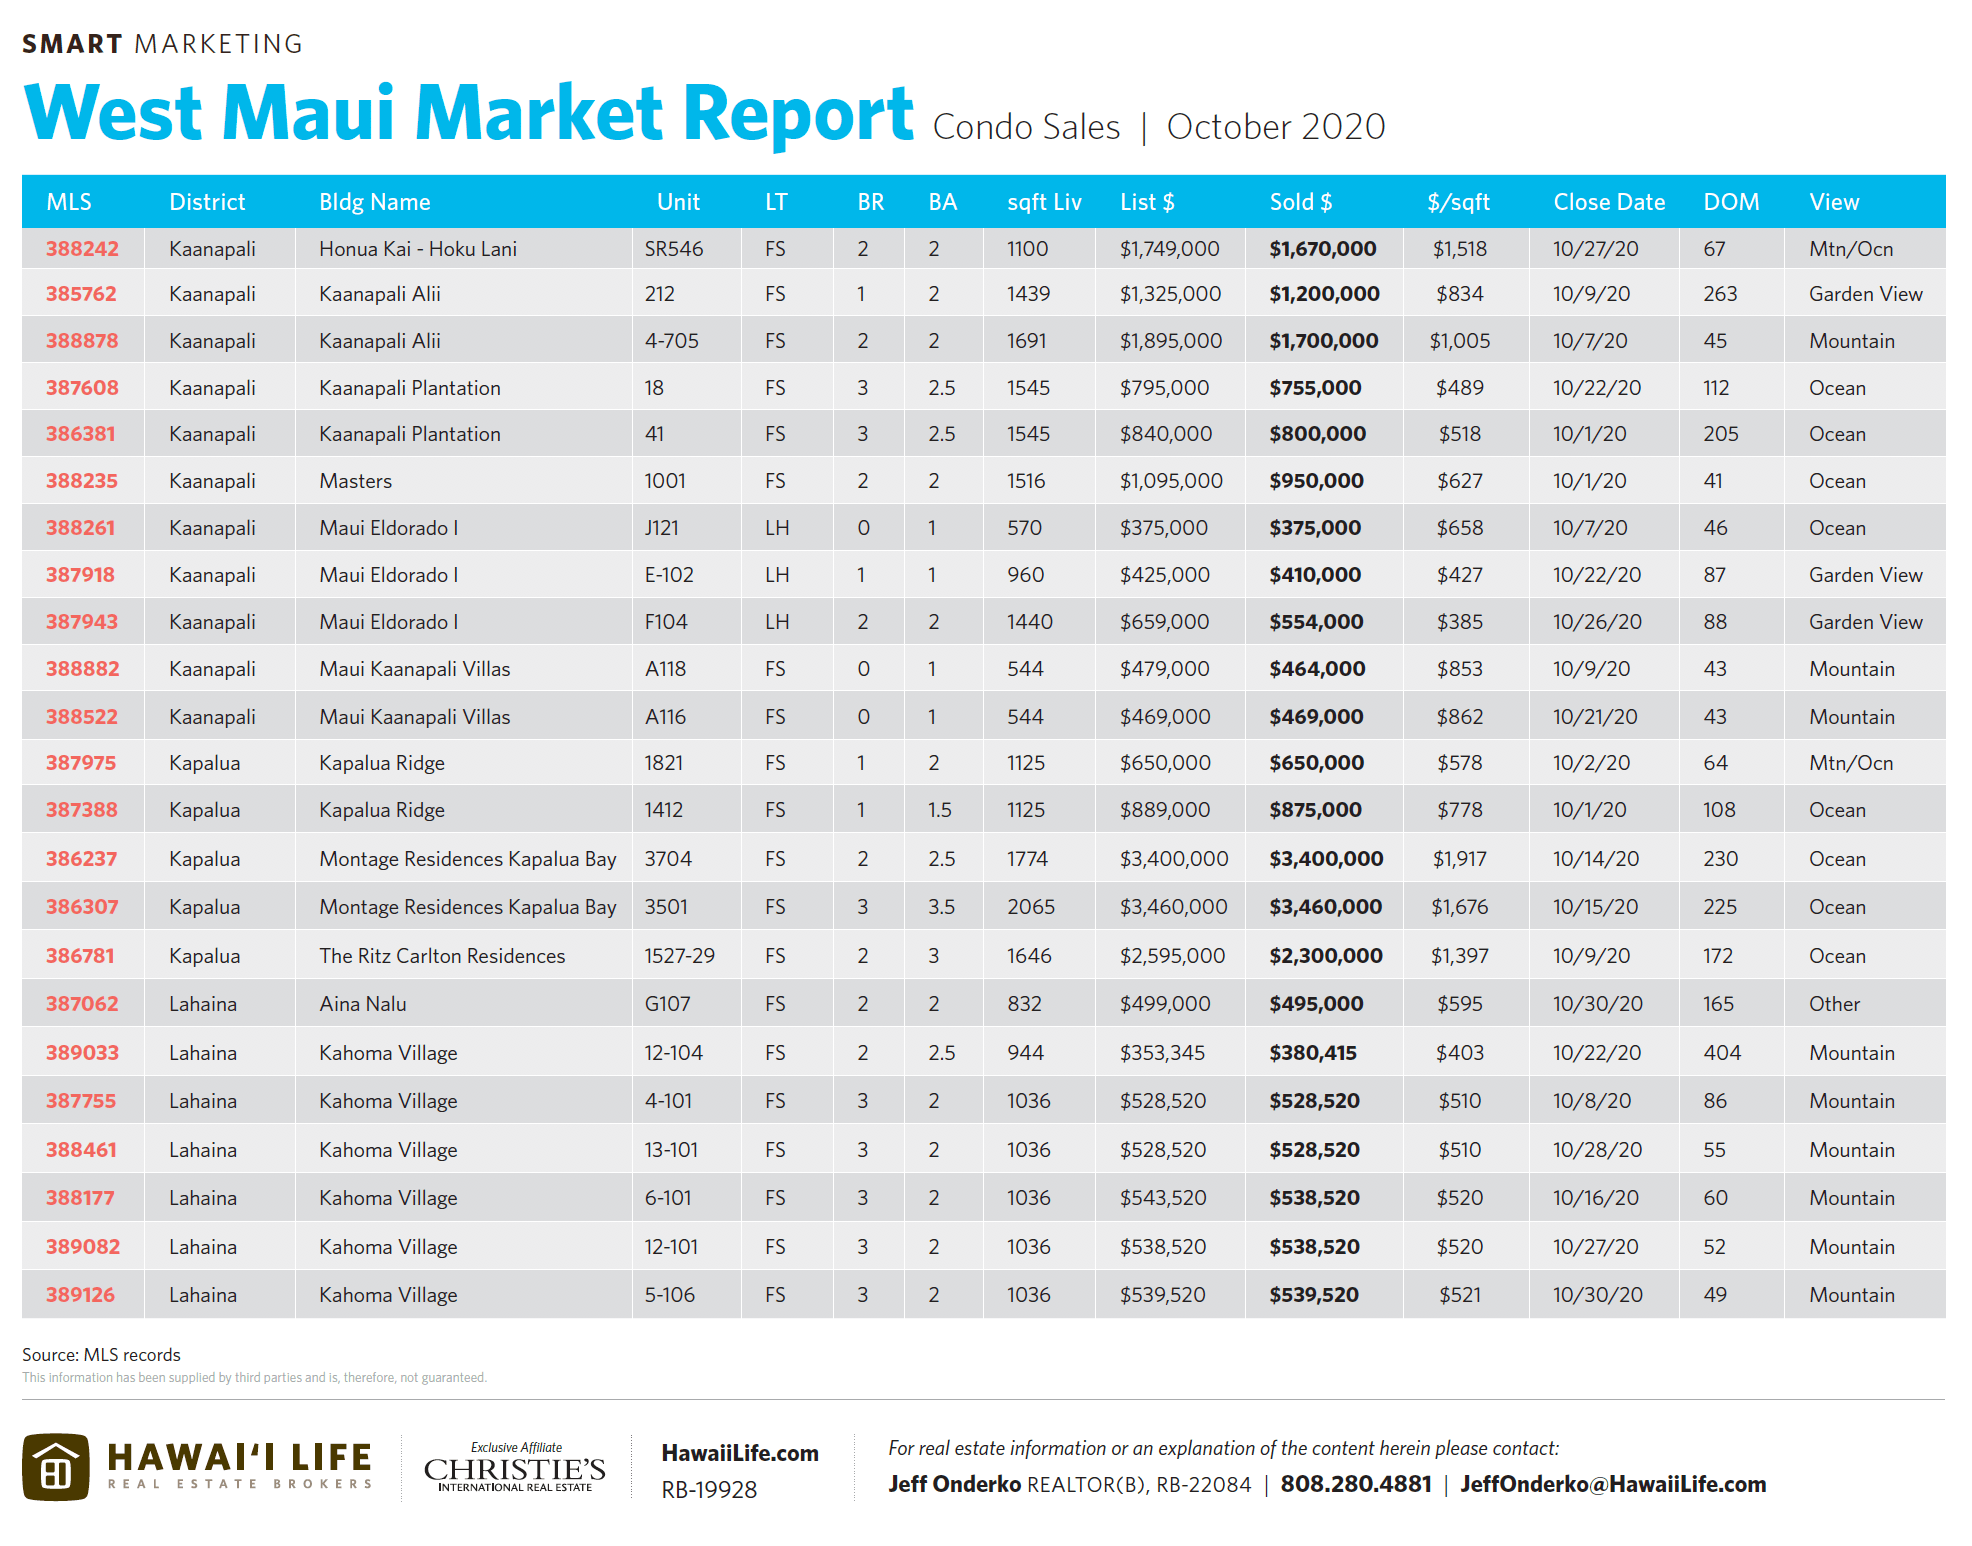
- Condos: October $550K vs. September $580K
- Land: n/a ($850K in September)
- Highest Priced Sales
- Home – $2.88M | Launiupoko
- Condo – $3.46M | Kapalua
- Land – n/a
- Lowest Priced Sales
- Home – $763K | Lahaina
- Condo – $265K | Napili Ridge in Nap/Kah/Honokowai areas
- Land – n/a
Historical Median & Average Price Comparison
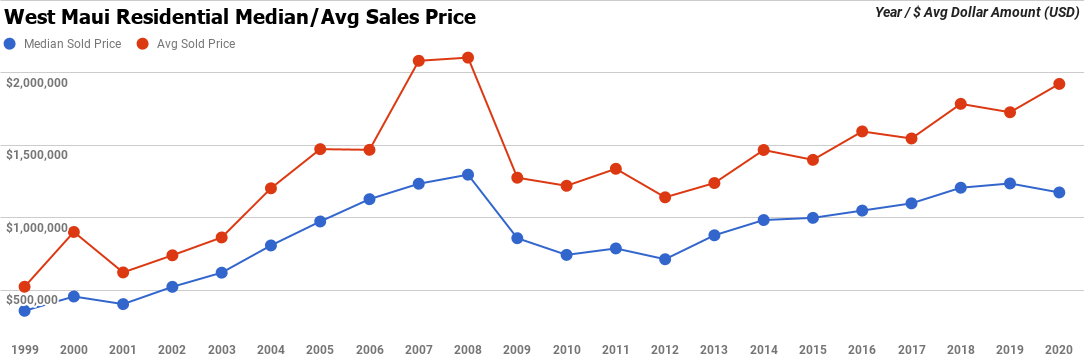
| Year | Median Sold Price | Median Price % Yr Gr | Avg Sold Price | Avg Price % Yr Gr | DOM | # Sold |
| 2020 | $1,175,000 | -5.0% | $1,922,501 | 11.3% | 158 | 109 |
| 2019 | $1,236,922 | 2.4% | $1,727,294 | -3.2% | 173 | 137 |
| 2018 | $1,207,500 | 9.8% | $1,785,099 | 15.4% | 188 | 130 |
| 2017 | $1,100,000 | 4.8% | $1,546,633 | -3.0% | 185 | 139 |
| 2016 | $1,050,077 | 5.0% | $1,595,145 | 14.0% | 194 | 147 |
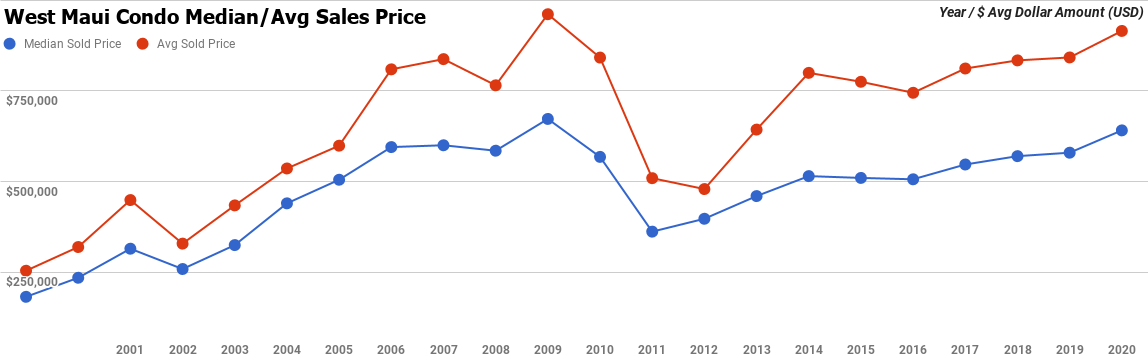
| Year | Median Sold Price | Median Price % Yr Gr | Avg Sold Price | Avg Price % Yr Gr | DOM | # Sold |
| 2020 | $641,000 | 10.6% | $914,917 | 8.7% | 192 | 420 |
| 2019 | $579,500 | 1.7% | $841,913 | 1.0% | 182 | 614 |
| 2018 | $570,000 | 4.2% | $833,812 | 2.8% | 157 | 549 |
| 2017 | $547,000 | 8.0% | $811,436 | 9.0% | 164 | 482 |
| 2016 | $506,250 | -0.7% | $744,555 | -3.9% | 211 | 490 |
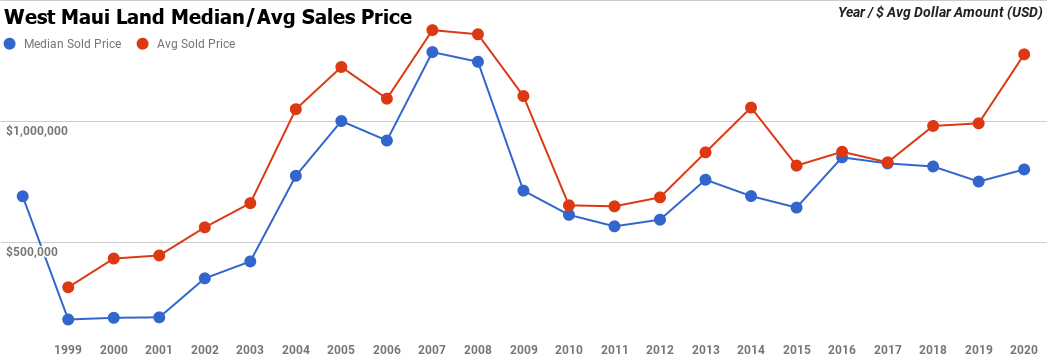
| Year | Median Sold Price | Median Price % Yr Gr | Avg Sold Price | Avg Price % Yr Gr | DOM | # Sold |
| 2020 | $800,000 | 6.7% | $1,275,577 | 28.8% | 195 | 14 |
| 2019 | $750,000 | -7.7% | $990,609 | 1.1% | 256 | 23 |
| 2018 | $812,375 | -1.5% | $979,829 | 18.1% | 526 | 22 |
| 2017 | $825,000 | -2.9% | $829,477 | -5.0% | 293 | 33 |
| 2016 | $850,000 | 32.3% | $873,147 | 7.0% | 294 | 49 |
Want to Know More?
If you are in the market for buying or selling West Maui real estate or have any questions about the area or the market in general, please feel free to contact us. I welcome the opportunity to give you information on my previous sales performance and marketing strategies. Or if you’re curious about what your property is worth in today’s market, it would be my pleasure to provide you with property information and a value assessment free of any sales pitch.
Related Articles
West Maui End of Summer | Homes & Land Moving Faster, Condos Slowing
Investors, Retreats & Crown Jewels | Recommended By Me, Not Listed By Me

Leave your opinion here. Please be nice. Your Email address will be kept private, this form is secure and we never spam you.