As part of my commitment to keeping the community informed about West Maui’s dynamic, micro market real estate environment, I’m bringing you an up-to-date, comprehensive property market summary of the Aina Nalu, Downtown Lahaina’s premier vacation resort community.
What You’ll Find
- Actual Sales Prices: learn exactly how much specific properties sold for
- Sales Volume: see the strength of the market in terms of how many properties sold
- Days on Market: understand how long it takes the average property to sell
- List Price vs. Sold Price: see how the final sales price compares to the listing price
- Price Per Square Foot: which is critical in calculating real estate values
- Asset % Growth: what is the year over year appreciation of my property
- Current Inventory: what is actively for sale and currently under contract
Before we dig into the numbers, make sure you subscribe to my blog if you want to be notified of future market reports as they come available.
Neighborhood Snapshot
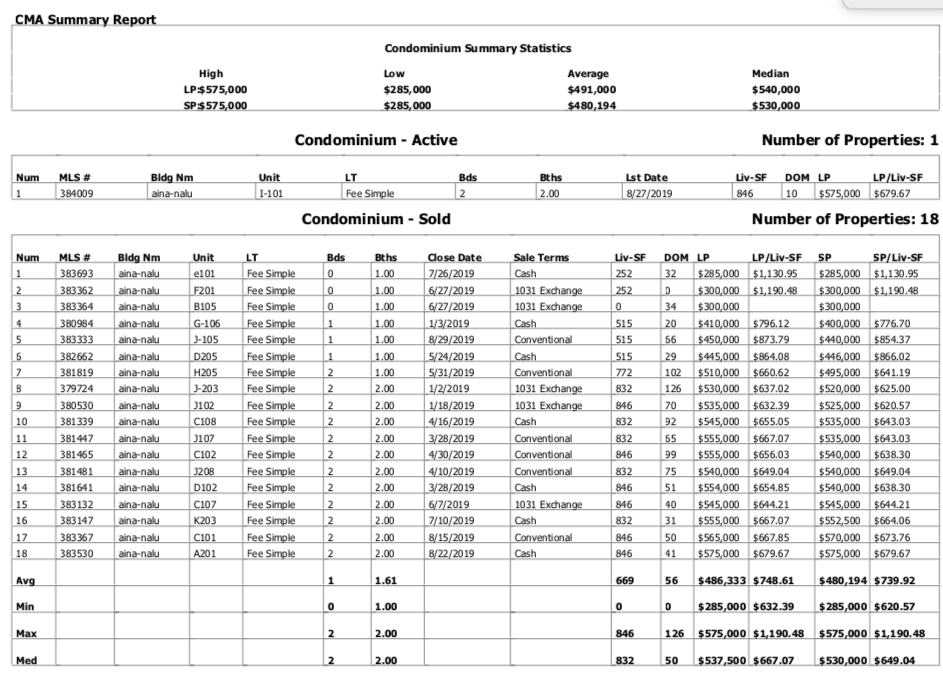
- The numbers say it all and what a run it’s been for Aina Nalu. In 2019 alone there have been 18 total sales and while 2-bedrooms generally dominate the landscape, there were 6 combined 1-bedroom & studio transactions so far this year.
- Since 2014 sales prices have increased 54% in the 2 bedroom category, 58% for 1-beds, and studios saw a 45% growth
- Even through significant price increase, Aina Nalu has still been in drastic demand. This year alone has had an average of 56 days on market (from actively listed to closing date), and the past 2 years have been very similar. Note: The average 2019 DOM for West Maui short term vacation rental properties is 154 days
- Currently there is 1 actively listed unit for sale listed at $575,000
Sales Sales & More Sales Data (click on the images/links for interactive)
| Aina Nalu | ||||||
|
2 Bedrooms
|
||||||
| Year | Avg List Price | Avg Sold Price | Yr Gr | % to List | DOM | # Sold |
| 2019 | $547,000 | $539,375 | 9% | 99% | 70 | 12 |
| 2018 | $498,745 | $494,864 | 20% | 99% | 64 | 11 |
| 2017 | $424,250 | $412,991 | 9% | 97% | 89 | 16 |
| 2016 | $397,000 | $380,071 | 2% | 96% | 104 | 14 |
| 2015 | $393,957 | $371,536 | -1% | 94% | 233 | 14 |
| 2014 | $390,125 | $373,500 | 16% | 96% | 119 | 4 |
| Aina Nalu | ||||||
|
1 Bedrooms
|
||||||
| Year | Avg List Price | Avg Sold Price | Yr Gr | % to List | DOM | # Sold |
| 2019 | $435,000 | $428,667 | 14% | 99% | 24.5 | 2 |
| 2018 | $380,000 | $376,667 | 11% | 99% | 47 | 3 |
| 2017 | $350,750 | $338,500 | 4% | 97% | 115 | 4 |
| 2016 | $349,900 | $325,000 | 5% | 93% | 43 | 1 |
| 2015 | $330,000 | $309,000 | 9% | 94% | 152 | 4 |
| 2014 | $306,750 | $284,750 | 15% | 93% | 56 | 4 |
| Aina Nalu | ||||||
| Studio Units | ||||||
| Year | Avg List Price | Avg Sold Price | Yr Gr | % to List | DOM | # Sold |
| 2019 | $295,000 | $295,000 | 9% | 100% | 22 | 3 |
| 2018 | $275,000 | $270,000 | 10% | 98% | 25 | 1 |
| 2017 | 0 | |||||
| 2016 | 0 | |||||
| 2015 | $254,000 | $246,000 | 26% | 97% | 29 | 2 |
| 2014 | 0 |
The Aina Nalu Active Market
Want to Know More?
If you are in the market for buying or selling Aina Nalu real estate or have any questions about the area or the market in general, please feel free to contact me. I welcome the opportunity to give you information on my previous sales performance and marketing strategies. Or if you’re curious about what your property is worth in today’s market, it would be my pleasure to provide you with property information and a value assessment free of any sales pitch.

Leave your opinion here. Please be nice. Your Email address will be kept private, this form is secure and we never spam you.