Here’s a look at the 2022 Q3 real estate market report, taking a snapshot of the US market as a whole and then zooming in more specifically to Oahu, Hawaii
Price Appreciation
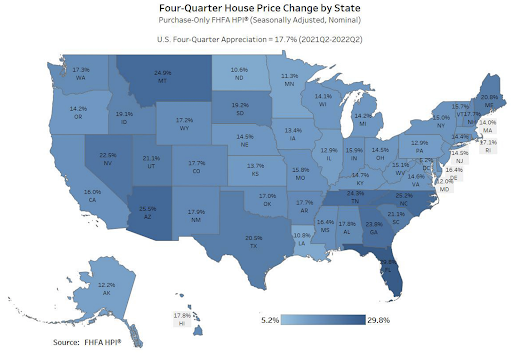
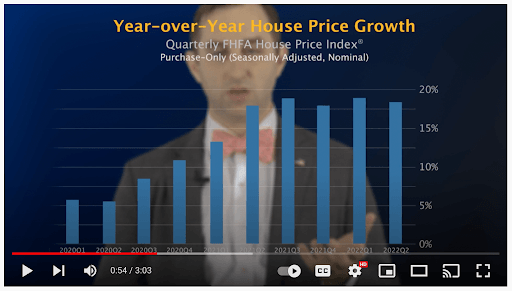
If we look at the big picture, US house prices rose 17.7% on average from the second quarter 2021 to second quarter 2022. This is the 7th consecutive quarter of double digit growth. The 2nd Quarter, 2022, marked the 42nd straight quarter of positive annual price appreciation. We have not seen a negative price change in over a decade, since 2012 (FHFA.gov)
Price Change by State
All 50 states and the District of Columbia, saw price appreciation in the 2nd quarter. If we exclude the District of Columbia, with 6% growth, all 50 states had double-digit price appreciation.
The state of Hawaii is ranked 15th, with an 18% appreciation.
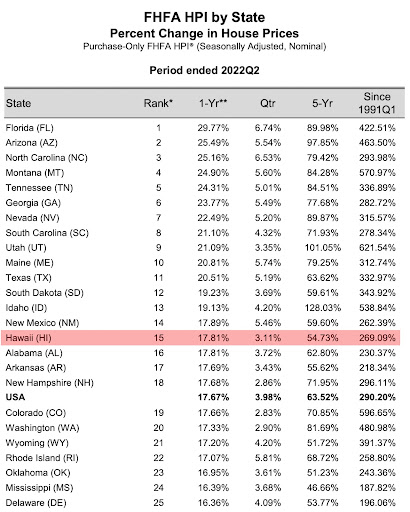
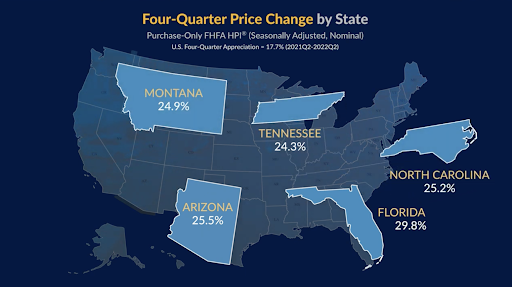
Florida & Arizona lead the nation with nearly 30% & 26% price appreciation, respectively (FHFA.gov)
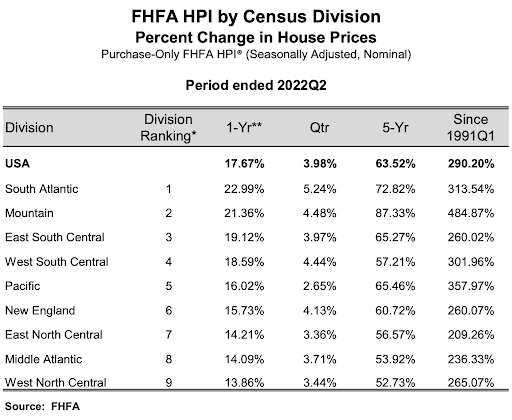
The South Atlantic region led the nation in price appreciation. The Mountain Region has typically led the price appreciation charge. The South Atlantic region’s elevated activity is a result of the states with the prosperous economies of Texas, Tennessee, North Carolina & No.1, Florida.
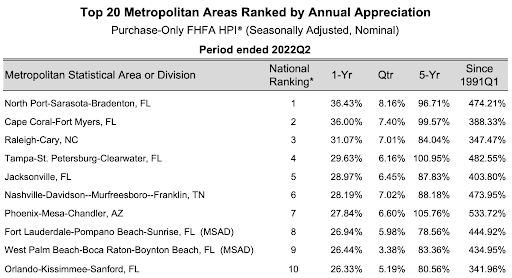
Price Change by City
The City and County of Honolulu is up almost 13%, year over year. Honolulu is ranked 82nd after cities like, #1, North Port-Sarasota-Bradenton, FL, up 37% and #2, Cape Coral-Fort Myers, FL, up 36% (FHFA.gov).
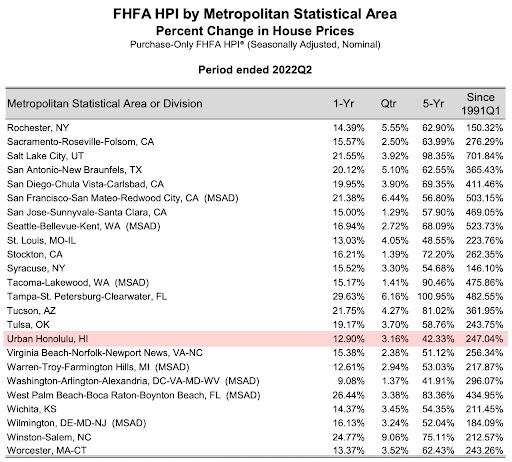
Seven of the top 10 cities, in price appreciation, were in Florida.
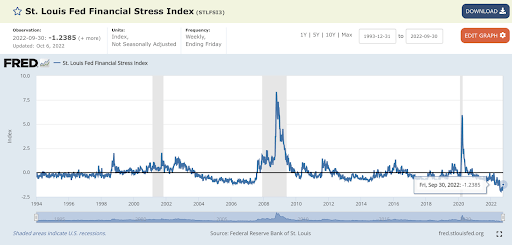
Financial Stress Index
The nation’s Financial Stress Index on September 30th, 2022 was -1.24 points. This number is up a point in the past month, with increased interest rates, gas prices, etc, but it is still way down compared to our last two recessions highlighted in gray. Where the index was at 5.48 points on March 20th, 2020, and nearly 9 points during the financial meltdown of 2008.
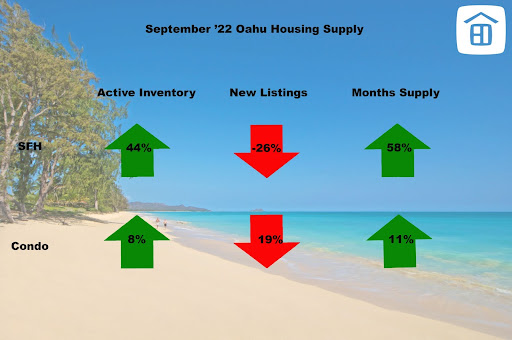
Months Supply
In September, 2022, the supply indicators were mixed. The figures where Single Family Homes jumped 44% in active listings and 58% in months supply, need to be taken with a grain of salt, because these numbers are being compared to September 2021, which is by far the greatest year in real estate history. It is also important to note, that months supply is still ridiculously low at just above ~2 month of supply. 6 months is considered a balanced market. Anything below that is a “seller’s market.”
Sales Volume
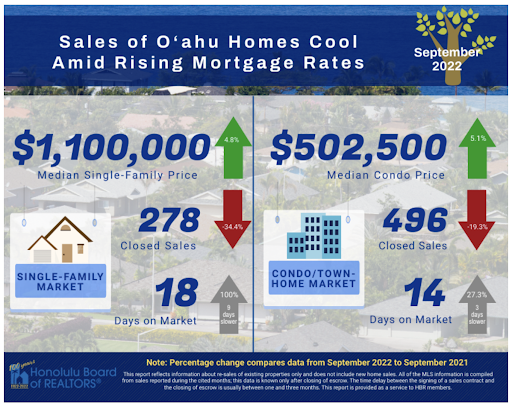
Median sales prices continue to move up (~5%), sales volumes are off 20-30%, over last year, and days on market is creeping up, but still super low… around two weeks to sell property. The decreased activity going into the 4th quarter may also be an indication of the markets returning to a more normal, cyclical pattern. Where we see a “Spring/Summer selling season” followed by a slower 4th quarter, because families are traveling and hosting parties again for Halloween, Thanksgiving, Christmas and New Years.
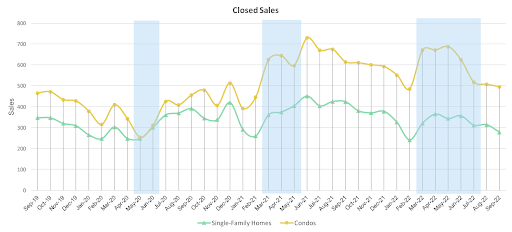
Traditionally, we see the closing volume of single-family homes and condominiums move in lockstep with each other. When covid hit in the Spring of 2020, we saw a sharp decline in the closings and demand for condominiums (highlighted in blue). Perhaps, largely attributable to the desire for people to not have shared HVAC systems, common amenities & shared elevators. This was the first time in recorded Hawaii real estate history, where we witnessed the “decoupling” of single-family homes and condominiums. We can see further highlighted examples, where closings are moving independently of each other.
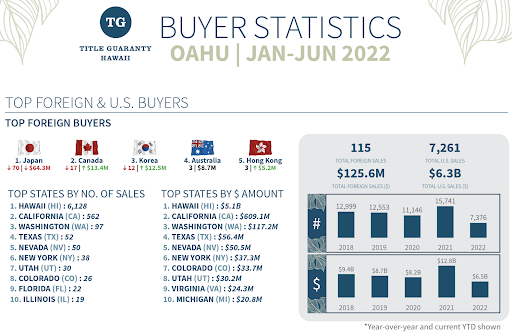
Who is Buying Hawaii Real Estate?
For the entire state of Hawaii, nearly 12,000, or $10.7B, of real estate transactions occurred in the first two quarters of 2022. Fully 65% of the buyers were Hawaii Residents. The next largest group of buyers were from California, at nearly 16%. Canada & Japan were the top foreign buyers, totaling about $181M over 146 sales (Title Guaranty Hawaii)
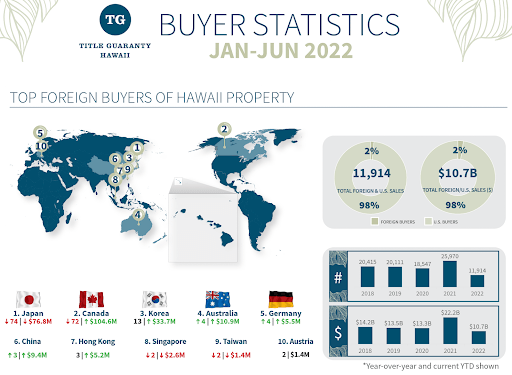
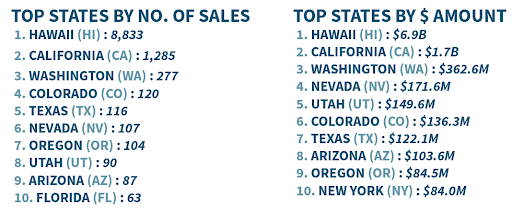
On Oahu, fully 81% of the transactions were Hawaii resident buyers. The next largest total of purchases came from California, at 10%. Japan is the number one foreign investor on Oahu. 84% of Japanese investment occurs on Oahu.
Price Growth
In the second quarter, the market remained hot. The rate of price growth hovered around 20% for the 5th consecutive quarter. In the first half of 2020, we saw above average growth levels at around 5-6%. In the second half of 2020, we saw border closings and supply chain issues. These issues impacted construction and renovations, which pushed up prices for real estate. In 2021, we saw 50 year low mortgage rates that caused intense demand. Couple this intense demand with low supply, and it is no wonder that Q3 2021, saw double-digit gains in all 50 states and the District of Columbia. (Source FHFA)
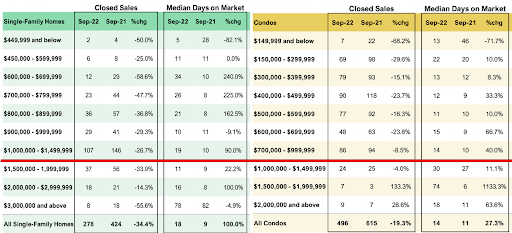
Price Points
For single-family homes, we see a sweet spot from $1-1.5M, where the predominant amount of closings are occurring. For condominiums (yellow chart), we can see a sweet spot at $700-999k. The number of closings decreases beyond that point.
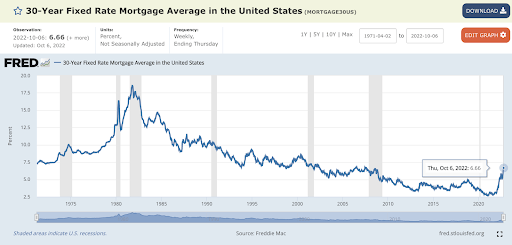
Interest Rates
Interest rates hit a 50-year low in January 2021, of 2.65%. Since then, on June 16, interest rates have more than doubled. Interest rates have been a W-shaped, bounce-a-thon since then and we are hovering at 6.66%, on 10/6/22.
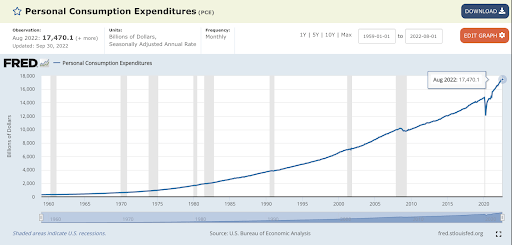
Inflation
Personal Consumption Expenditures is up 31%, since the onset of Covid.
Inflation, consumer prices index is up 11% since COVID.
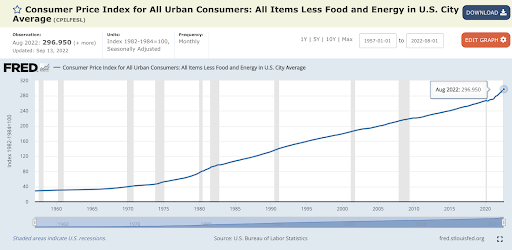
Owning real estate is a good hedge against inflation.
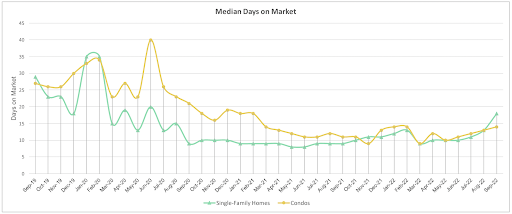
Days on Market (Velocity)
Days on market is a good measure of “market velocity” or how quickly homes are selling. In September, market velocity for single-family homes and condominiums were 18 & 14 days, respectively (~2 weeks to sell property!). Last September it took half as long to sell a single-family home (9 days). Condos are 27% slower.
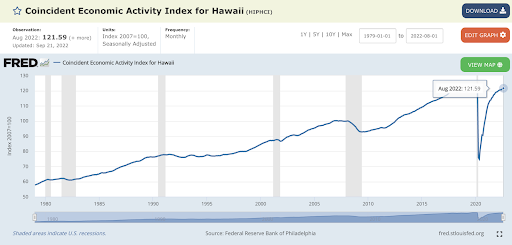
Economic Activity
The line in the graph represents an index that tracks Hawaii’s economic activity. We can see the last 6 US recessions highlighted in gray. Since November of 2019, the index dropped 39%. In August, we were back within a several points of Pre-Covid, all time highs.
Visito Spending, Days & Arrivals
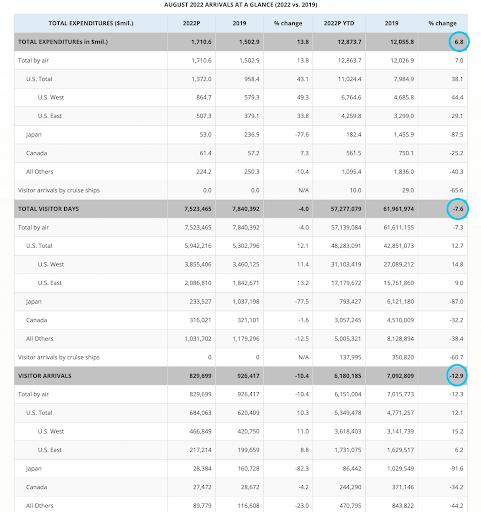
Visitor expenditures thru August, 2022, were +6.8% higher than the same period, 2019.
Visitor Days are within ~8% of pre-Covid numbers.
Visitor Arrivals ~13% lower than pre-Covid.
These statistics may find pre-Covid numbers when foreign travel starts to ramp up shortly.
Summary for 3rd Quarter, 2022
In summary, prices continue to creep up as a result of low supply and high demand. Demand takes a hit as interest rates have more than doubled in the past 21 months. This increase in interest rate may have been causing Single family homes to show continued signs of slowing with a 34% lower closing volume and a 100% increase in days on market in September. Condo closing volume is down 2% and days on market is up 27%. Supply indicators are mixed, but overall remain historically low. Reduced market activity going into the 4th quarter may be indicative of the market’s return to a more normal, cyclical trading pattern. Market velocity is at 14 to 18 days to sell property and Hawaii’s economy continues to recover with lifted Covid restrictions.
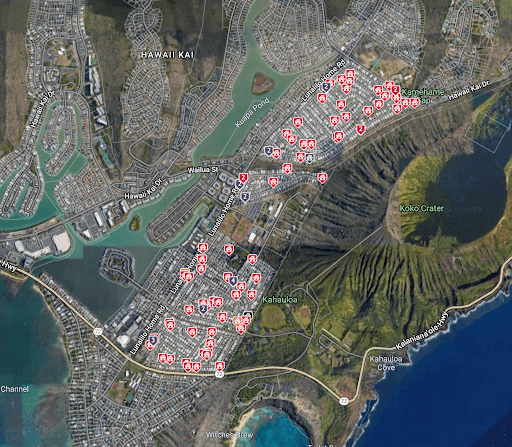
Koko Head Terrace Neighborhood Spotlight
Did some charts on the last 2 years of data for the 94 trades in the Koko Head Terrace area.
In 2021, there were 29 homes sold (blue), 9 were for sale at the end of the year (green) and 4 homes did not sell (expired, withdrawn, etc). An average of 2.4 homes sold per month. There was a months supply of 3.7 months on the market. These numbers gave Koko Head Terrace home sellers a 69% odds of selling.
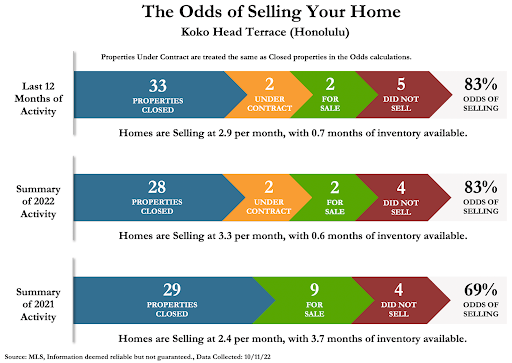
So far in 2022, there have been 28 closings (blue), there are 2 homes under contract (orange), there are 2 active listings (green) and 4 homes have not sold this year (red). Homes are selling at 3.3 per month (~unchanged) and there is .6 months of inventory on the market (84% decrease in inventory). These numbers give us an 83% odds of selling.
6 months of inventory is considered a “balanced market.” Less than 6 months is considered a seller’s market and above 6 months is considered a buyer’s market.
So in supply and “odds of selling” terms, still very much a seller’s market.
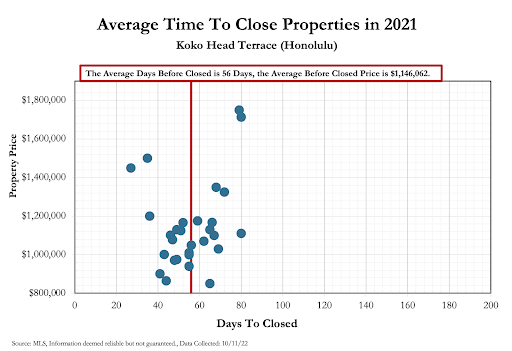
In 2021, it took an average of 56 days to close a property for an average price of ~$1.15M
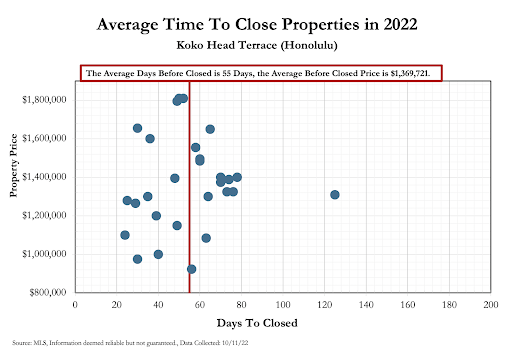
In 2022, it has taken 55 days (unchanged) to close a property for an average of ~$1.37M (16% increase)
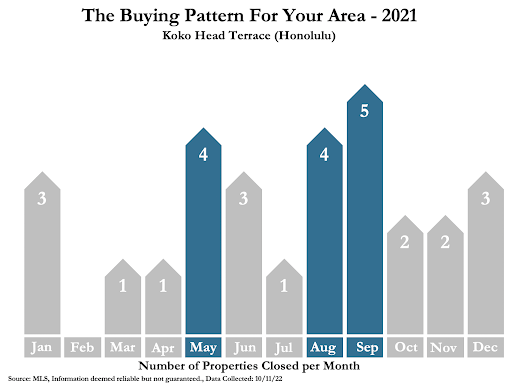
These two charts show us the distribution of closings that have occurred in Koko Head Terrace in the past 2 years. In 2021, we saw a typical Spring and Summer Selling Season. But also, consistent activity throughout the year. Uninterrupted by the typical breaks in the school year and travel/party plans usually associated with the 4th quarter.
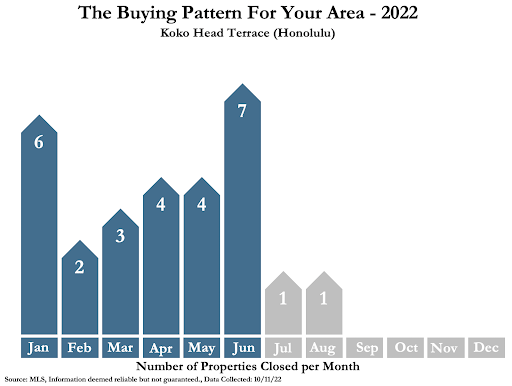
In 2022, we see solid closing activity through June, with a drop off in July/August.

Each dot in this chart represents a closing in the past 3-4 months. The line tries to show the relationship between price and square footage.
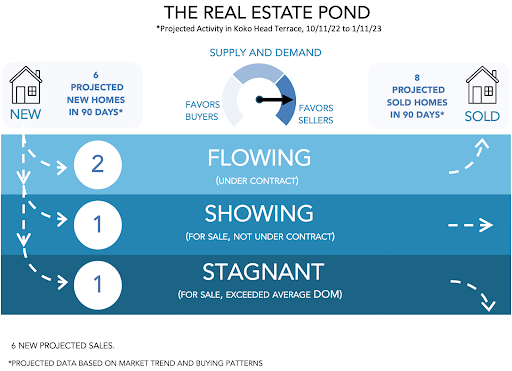
This chart takes the last two years of data and tries to predict the market activity for the next 90 days, in Koko Head Terrace. It is predicted that we will see 6 new homes come on the market and we will see 8 sales occur.
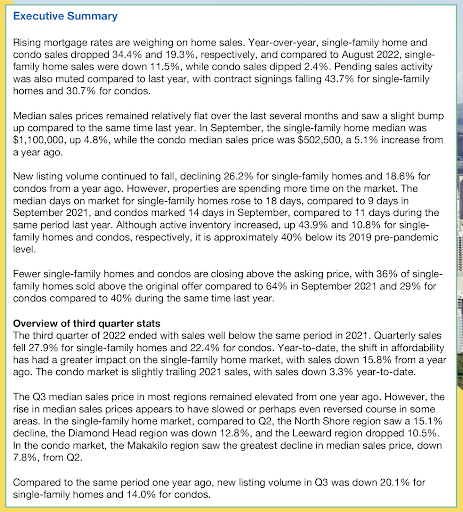
August 2022 data for Hawaii Kai:
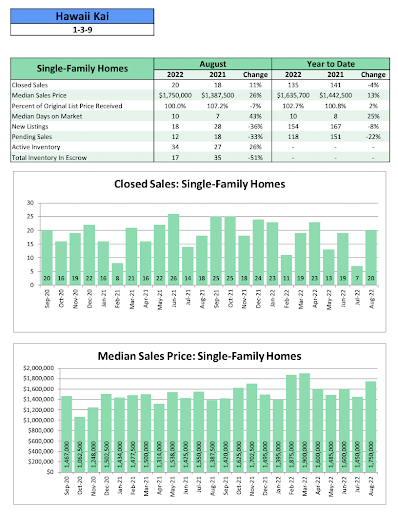
Source: Hicentral MLS
Source: Hicentral MLS

Leave your opinion here. Please be nice. Your Email address will be kept private, this form is secure and we never spam you.