In summary, housing prices remain stable, despite demand taking a hit, as interest rates have more than doubled in the past two years. Nationally, we saw the 5th straight ~20% price growth per quarter, year over year, in the summer of 2022. The Summer ’22 saw all states with double digit price growth. The Fall ’22 saw rapid deceleration with 16 states having single digit growth, with an average of 12.4%. Supply indicators surge drastically in comparison to the “greatest years” in real estate, but still remain historically low. Closing volumes continue to shrink as the real estate market contracts. UHERO is forecasting a US recession for 2023, but feels Hawaii will likely be spared due to increased foreign travel and the Infrastructure Investment and Jobs Act. Inflation appears to have peaked in Summer ’22 and oil prices return below what they were when Russia first invaded Ukraine. Market velocity is at about 3 weeks to sell property and Hawaii finally reaches Pre-Covid visitor expenditures & economic activity numbers in Winter ‘22.
Price Appreciation
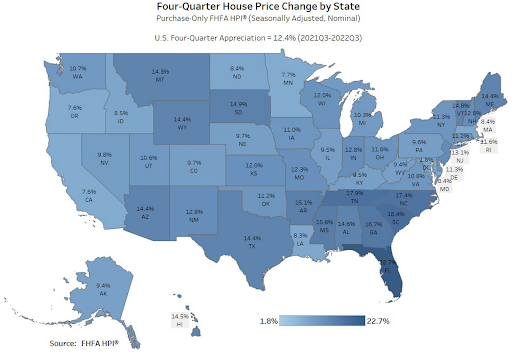
If we look at the big picture, US house prices rose 12.4% on average in the 3rd quarter of 2023, year over year. The 3rd quarter marked the 8th consecutive quarter of double digit growth and the 43rd straight quarter of positive annual price appreciation. We have not seen a negative price change in over a decade, since 2012. However, a rapid deceleration in price growth is evident and will be visible in further charts in this report (FHFA.gov)
Price Change By State
In Q2, we saw double digit price growth in all 50 states (excluding the District of Columbia – 6%). In the 3rd quarter, all 50 states continued to have positive price appreciation, but 16 states only saw single digit price growth. The state of Hawaii is ranked 11th, with a 15% appreciation.
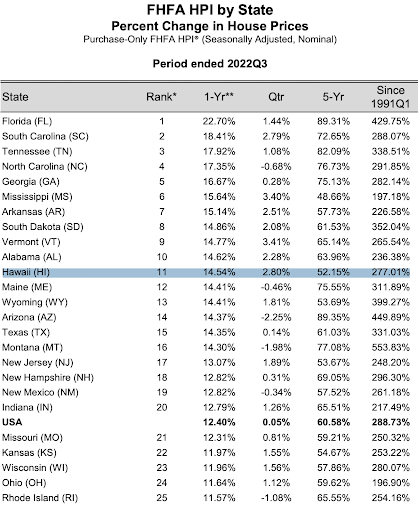
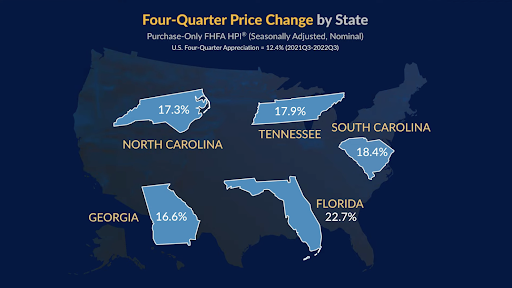
Florida & South Carolina lead the nation with nearly 23% & 19% price appreciation, respectively (FHFA.gov)
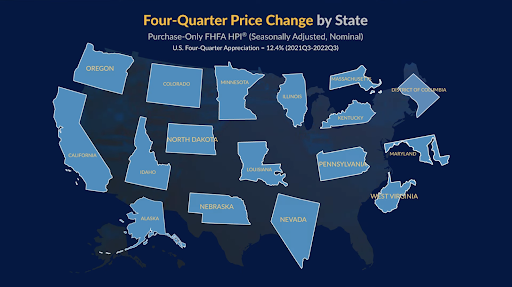
In the chart below, we can see the 16 states that only saw single digit price appreciation. Evidence of price growth deceleration
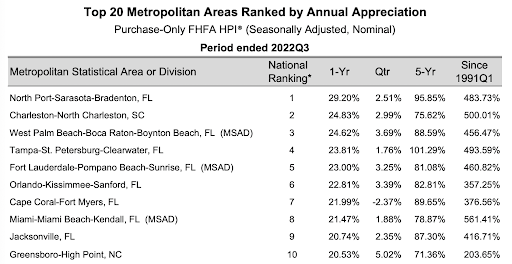
Price Change By City
The City and County of Honolulu is up almost 10%, year over year. Honolulu is ranked in the top 60 after cities like, #1, North Port-Sarasota-Bradenton, FL, up 29% and #2, Charleston-North Charleston, SC, up 25% (FHFA.gov).
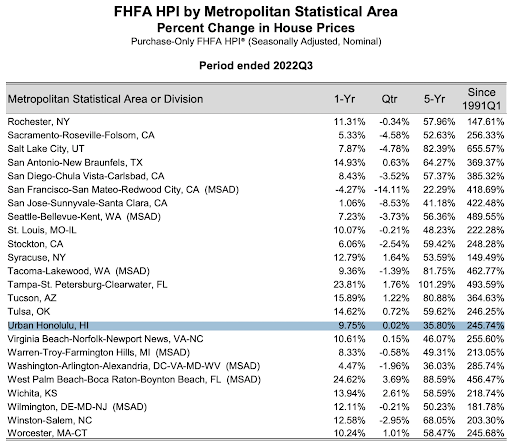
Eight of the top 10 cities, for price appreciation, were in Florida.
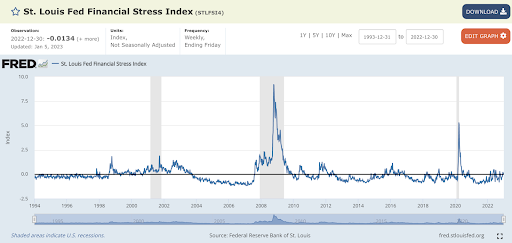
Financial Stress Index
The nation’s Financial Stress Index on December 30th, 2022 was -.0134 points. This number is up a point in the past month, with increased interest rates, inflation, gas prices, etc, but it is still way down compared to our last three recessions highlighted in gray. Where the index was at 5.48 points on March 20th, 2020, and nearly 9 points during the financial meltdown of 2008.
Months Supply
The supply indicators in December 2022, were indicative of a market in flux and change. The figures where Single Family Homes jumped 93% in active listings and 163% in months supply, need to be taken with a grain of salt, because these numbers are being compared to December 2021, which is by far the greatest year in real estate history. It is also important to note, that months supply is still ridiculously low at just above ~2 months of supply. 6 months is considered a balanced market.
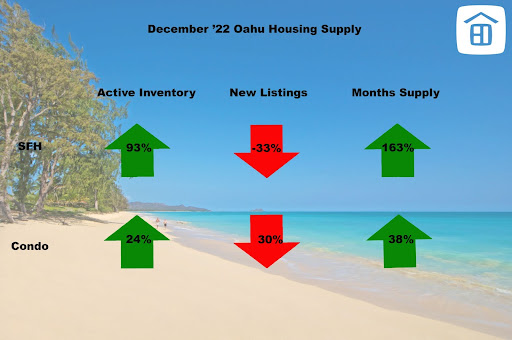
Months supply is still very low and below 6 months, is considered a “seller’s market”
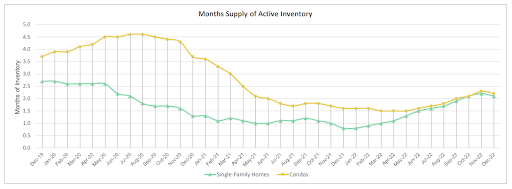
Source: HicentralMLS
Sales Volume
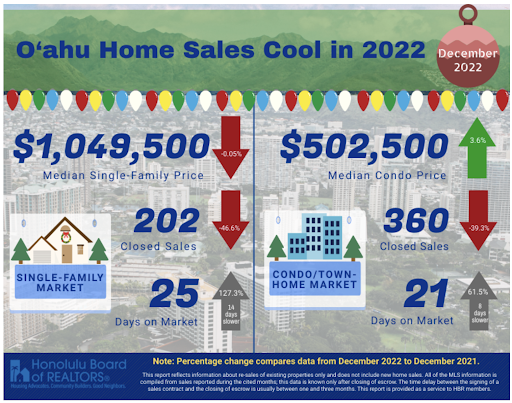
Median sales prices are down half a point, for single family, and up nearly 4% for condominiums. Sales volumes are off around 40%, over last year, and days on market is around 3 weeks to sell property. In addition to the market slowing, it appears we have also seen a return to the normal, cyclical patterns of real estate. Where the 4th quarter typically slows and only accounts for ~10% of the annual sales volume. The typical seasonality of real estate consists of a “Spring/Summer selling season” followed by a slower 4th quarter. The 4th quarter is slow, because families are traveling and hosting parties for Halloween, Thanksgiving, Christmas and New Years. During COVID, the traveling and parties were cut out, so real estate activity continued all year.
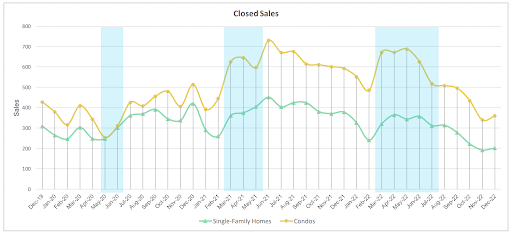
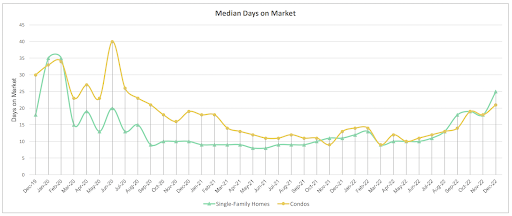
Traditionally, we see the closing volume of single family homes and condominiums move in lockstep with each other. When covid hit in the Spring of 2020, we saw a sharp decline in the closings and demand for condominiums (highlighted in blue). Perhaps, largely attributable to the desire for people to not have shared HVAC systems, common amenities & shared elevators. This was the first time in recorded Hawaii real estate history, where we witnessed the “decoupling” of single family homes and condominiums. We can see further highlighted examples, where closings are moving independently of each other.
Who Is Buying Hawaii Real Estate?
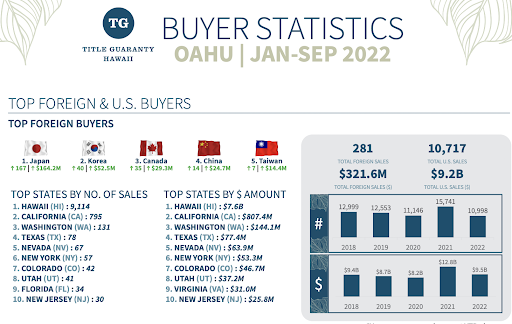
For the entire state of Hawaii, just over 17,000, or $15.3B, of real estate transactions occurred in the first three quarters of 2022. Fully 75% of the buyers were Hawaii Residents. The next largest group of buyers were from California, at ~10%. Japan was the top foreign buyer, totaling almost $177M over 171 sales (Title Guaranty Hawaii)
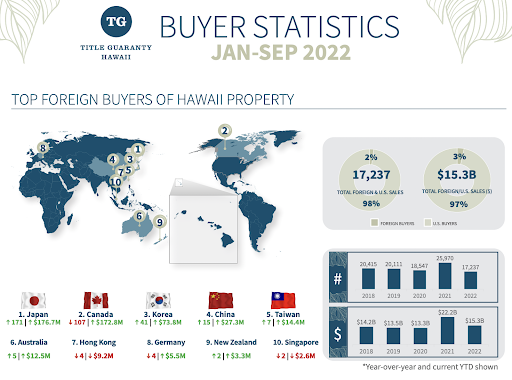
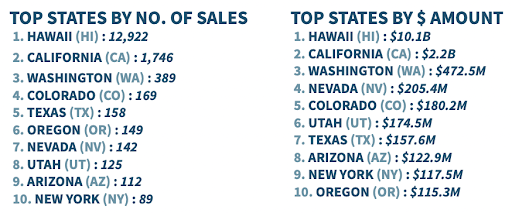
On Oahu, fully 85% of the transactions were Hawaii resident buyers. The next largest total of purchases came from California, at ~7%. Japan is the number one foreign investor on Oahu. 98% of Japanese investment volume numbers occur on the island of Oahu.
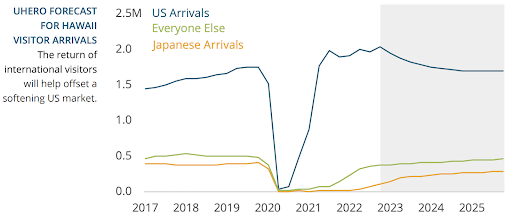
Visitor Arrival Patterns
We can see how “revenge travel” arrivals from the US ramped up sharply in 2021, to pre-covid numbers. In 2022, we just saw the beginning of arrivals from Japan, coming back.
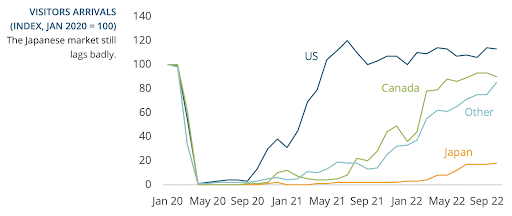
Another chart demonstrating where our arrivals have been coming from and how Japan has been lagging badly.
Construction Costs
This chart demonstrates the changes that have been occurring in prices for home building materials.
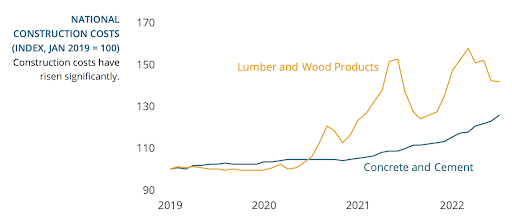
Source: UHERO
Price Growth
In the third quarter, the market remained hot, but with signs of price growth deceleration. The rate of price growth hovered around 20% for 5 consecutive quarters and now has started to come back down.
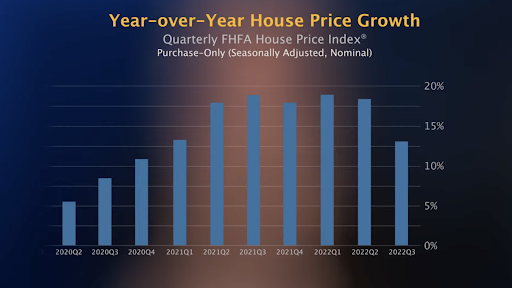
The third quarter, marked the 43rd straight quarter of price growth appreciation
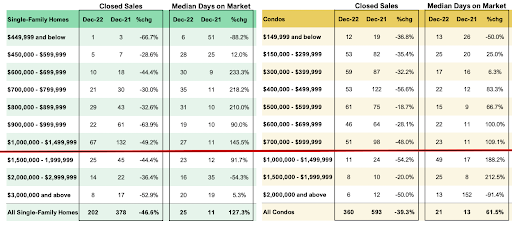
Price Points
For single-family homes, we see a sweet spot from $1-1.5M, where the predominant amount of closings are occurring. For condominiums (yellow chart), we can see a sweet spot at $700-999k. The number of closings decreases beyond that point.
Interest Rates
Interest rates hit a 50-year low in January 2021, of 2.65%. Two years later, in January 2023, interest rates have more than doubled to 6.48%. Interest rates have been a W-shaped, bounce-a-thon and peaked in October 2022 just above 7%.
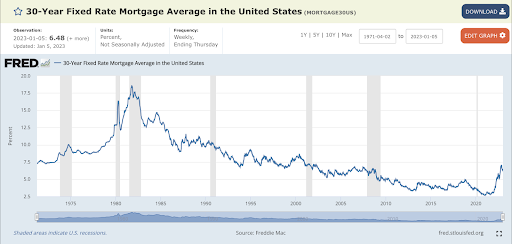
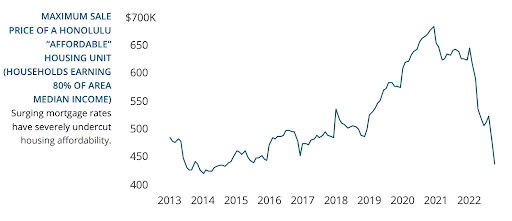
This sharp increase in interest rates, has translated into buyer’s purchasing power to go off a cliff
Source: UHERO
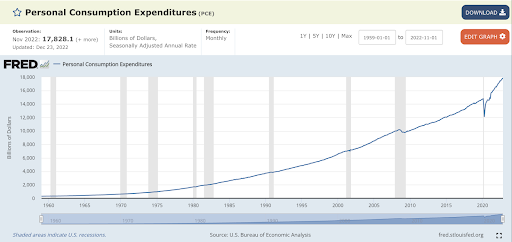
Inflation
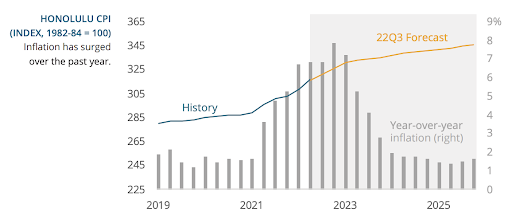
The rising cost of money is a result of the FED trying to tame inflation. Personal Consumption Expenditures are up 32%, since the onset of Covid.
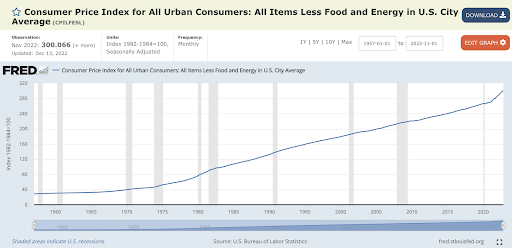
Consumer prices index is up 12% since COVID.
Owning real estate is a good hedge against inflation.
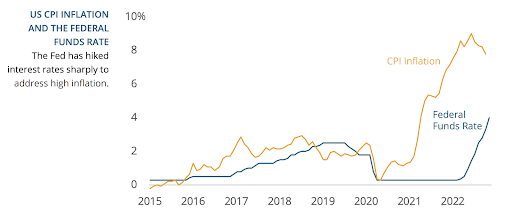
CPI peaked over 9% in the Summer of 2022. UHERO says, “The longer we see elevated inflation rights, the higher the probability of a mild recession in the US.”
Days On Market (Velocity)
Days on market is a good measure of “market velocity” or how quickly homes are selling. In December, market velocity for single-family homes and condominiums were 25 & 21 days, respectively (~3 weeks to sell property!). Last December, it took a fraction of the time to sell a single-family home 11 days). Condos are ~62% slower.
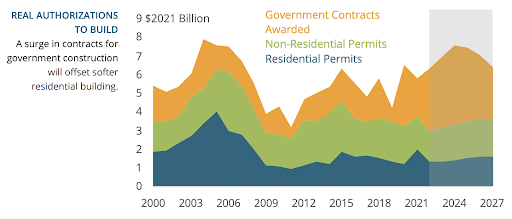
Economic Activity
The line in the graph represents an index that tracks Hawaii’s economic activity. We can see the last 6 US recessions highlighted in gray. Since November of 2019, the index dropped 39%. In October and November, 2022 (125 pts), we finally eclipsed our previous Pre-Covid, all time highs (123 pts).
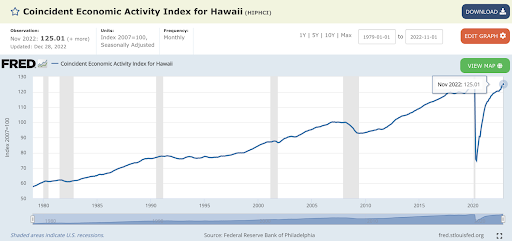
Our economy has finally reached pre-covid levels as a result of increased arrivals and a return to normal levels of visitor spending. Another boost has come from the FED in the form of ‘Infrastructure Investment and Jobs Act.’ In the chart below, we can see the drop off of residential and non-residential building permits and subsequent ramping up of government contract awards. These awards will likely keep Hawaii out of a recession (UHERO).
Visitor Spending, Days & Arrivals
Visitor expenditures hit a new record high, thru November, 2022, were +9% higher than the same period, 2019.
Visitor Days are within ~6% of pre Covid numbers.
Visitor Arrivals ~11% lower than pre Covid.
These visitor statistics hopefully will find pre covid numbers when the anticipated foreign travel begins to ramp up. 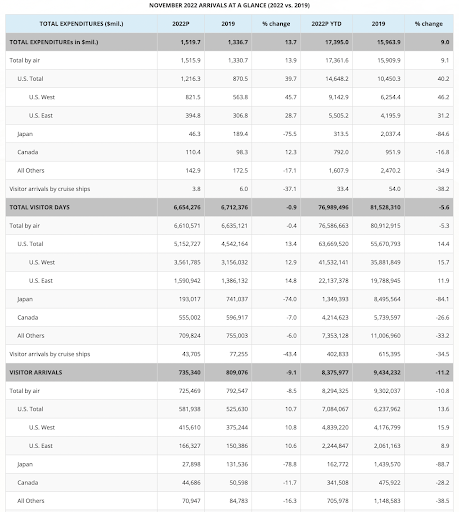
NEIGHBORHOOD SPOTLIGHT
Gold Coast Studios – Market Analysis
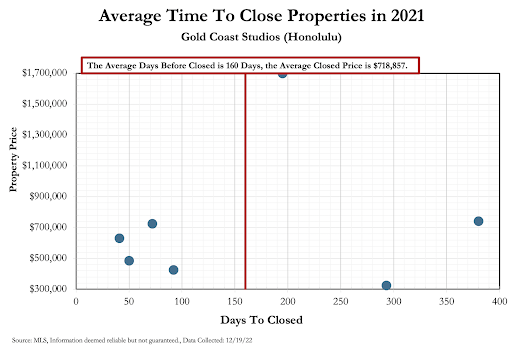
The following charts represent all studio, Fee Simple closings on the Gold Coast over the past 2 years.
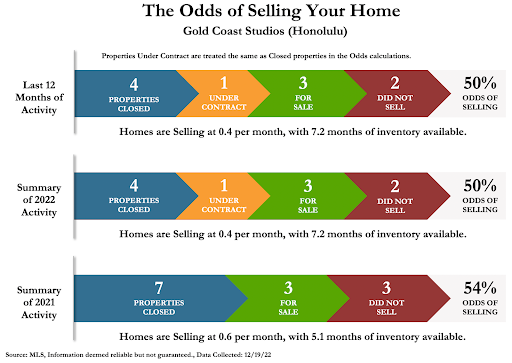
In the Odds of Selling Chart, we can see that in 2021, 7 properties sold (blue), 3 properties were still “for sale” at year’s end (green) and 3 units “did not sell” (red). Units were selling at .6/month and there was 5.1 months supply of inventory. Given these numbers, you had a 54% odds of selling.
So far in 2022, 4 studios closed (down 43%), 1 property is under contract, 3 units are currently on the market and 2 studios “did not sell” (red). The units are roughly selling at .4/month (down 33%) and there are 7.2 months of inventory on the market (up 41%). Odds of selling are down 4 points, to 50%.
6 months of supply is considered a balanced market and less than 6 months is considered a seller’s market. In summary, we see a 43% contraction in closing volume, 41% increase in months supply and a 33% decrease in sales velocity.
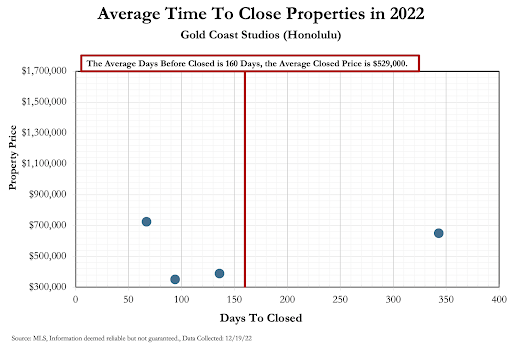
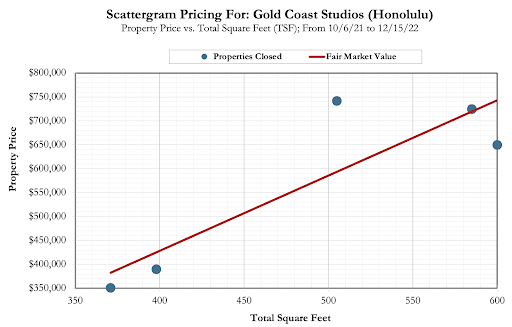
In the past two years, it has taken an average of 160 days to close a studio for an average sales price of $529k to $718k.
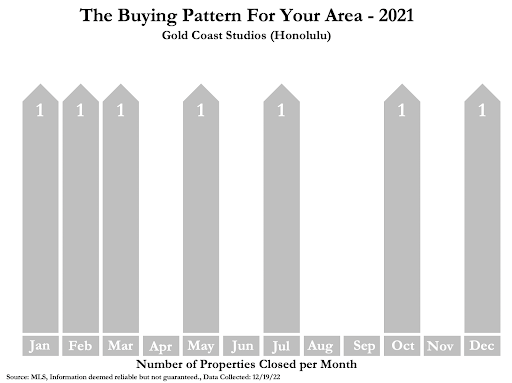
The Buying Patterns chart shows how the closeings are dispersed throughout the year. We can see a bunching of closings in the 1st quarter. This can be typical for studios in Waikiki/Gold Coast that trade frequently with Snow Bird visitors
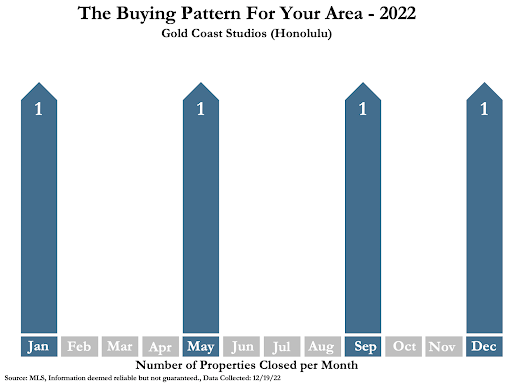
We can see the clear decrease in closings in 2022, and a pretty uniform dispersion of closings throughout the year.
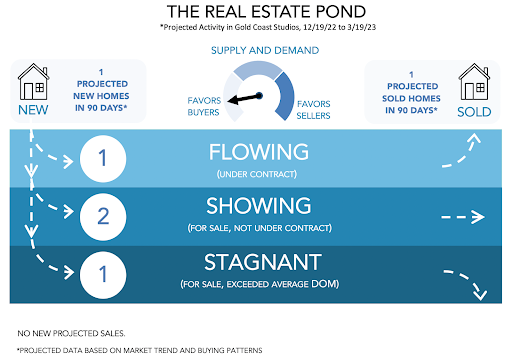
The Pond Chart takes the last 2 years of data and projects what the next 90 days will look like. Given these numbers, it is projected that in the next 90 days there will likely be 1 studio added to the market for sale and 1 closings will occur.
This chart tries to demonstrate the relationship between square footage and price. Each dot represents a closing since 10/6/2021

Cherie Tsukamoto
January 18, 2023
Great intel, Jake! Thanks for sharing your research with all of us!