If we look at the big picture, US house prices rose 5.7% on average, from 4th quarter 2017 to 4th quarter 2018
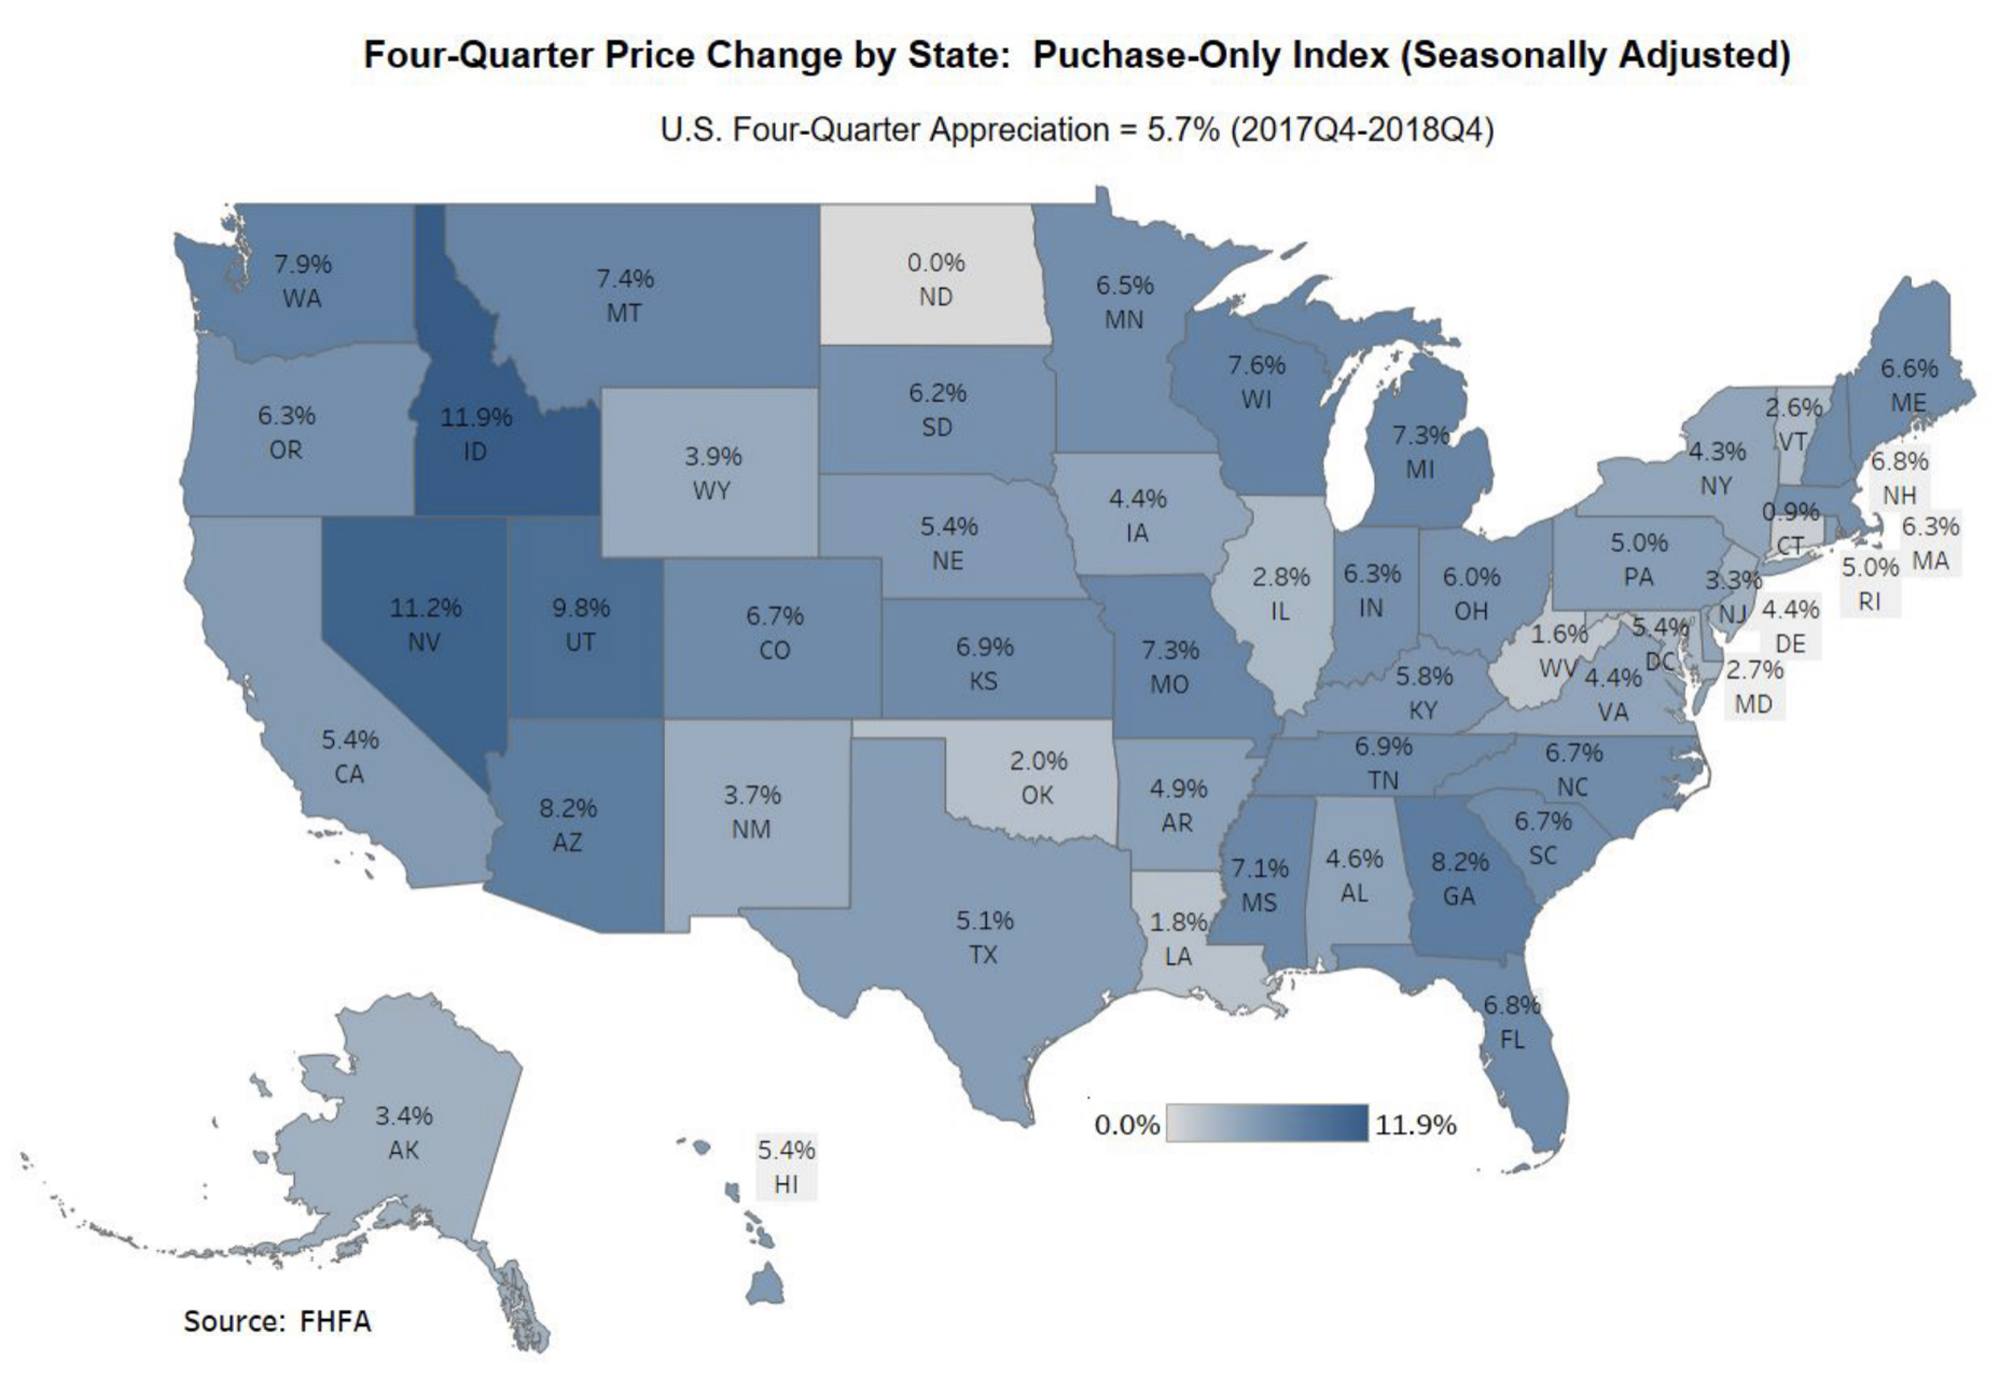
Price Change by State
The state of Hawaii is ranked 29th, with 5.4% price appreciation. Behind Idaho and Nevada, that lead the nation at nearly 12%.
Price Change by City
The City and County of Honolulu is up almost 6%, year over year. Honolulu is ranked 148th in the nation after cities like, #1, Las Vegas-Henderson-Paradise, NV, up 17.6% and #2, Boise City, ID, both up 16.6%.
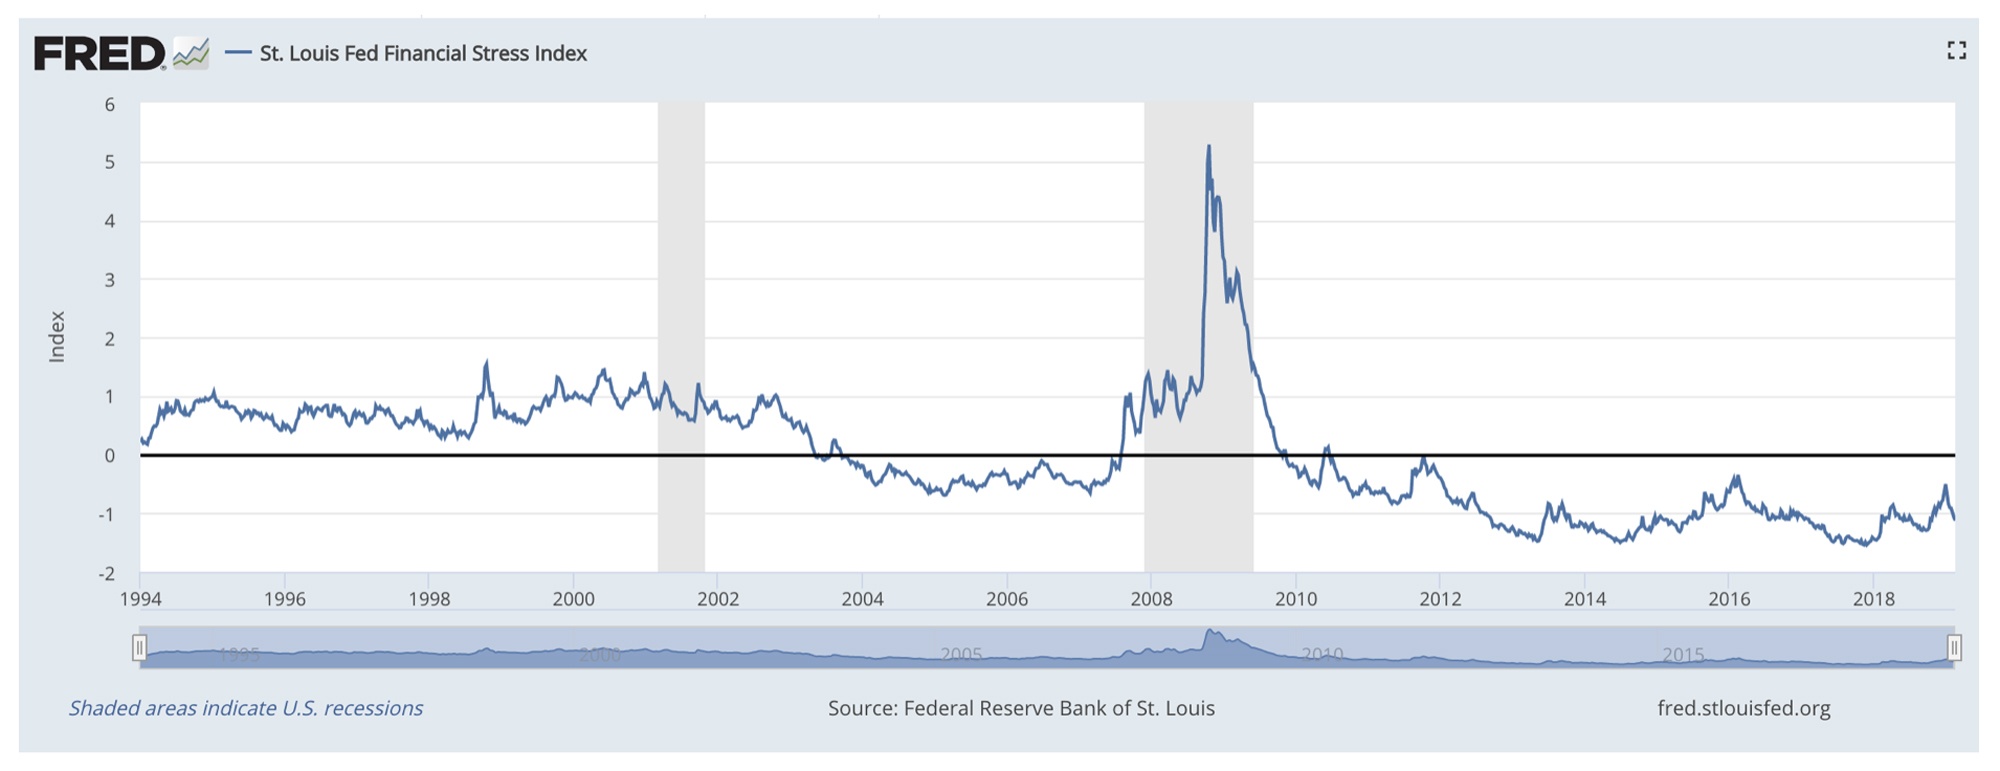
Financial Stress Index
If we look at the nation’s current Financial Stress Index, it is at negative 1.1 points. You can see we are down from the index’s highs of nearly 6 points during the last recession, highlighted in grey.
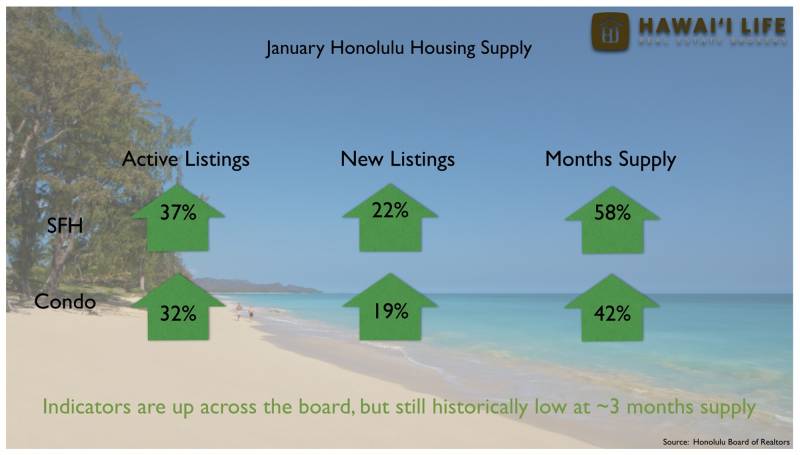
In January, all the supply indicators are up significantly across the board. However, from active and new listings to months of supply, the numbers remain historically low at about 3 months of supply.
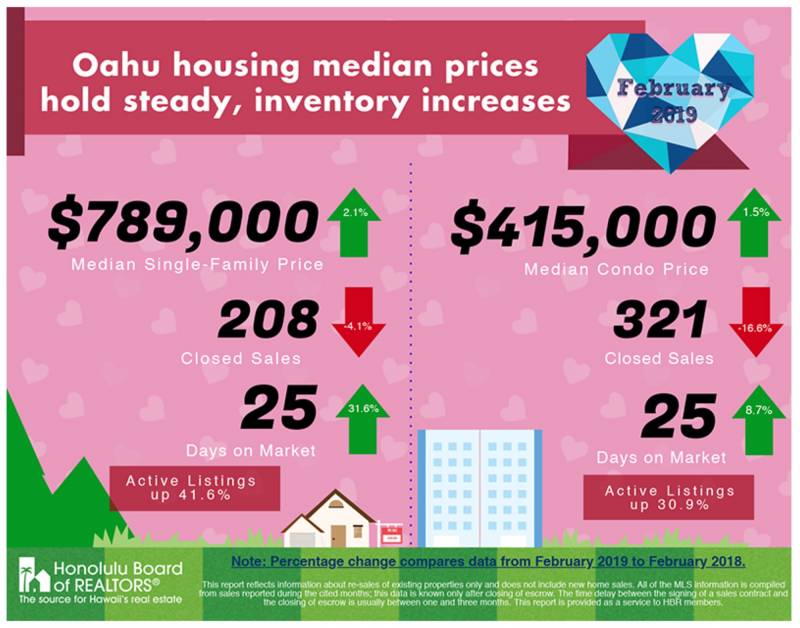
Sales – 2018
Median sales prices are up slightly, sales volume is down and days on market are increasing.
Days on market is a good measure of “market velocity” or how quickly homes are selling. In February, market velocity for single family homes is about 25 days for both SFH & Condos. These numbers are up about 32% for single family homes and 9% of condominiums year over year (Source HBR).
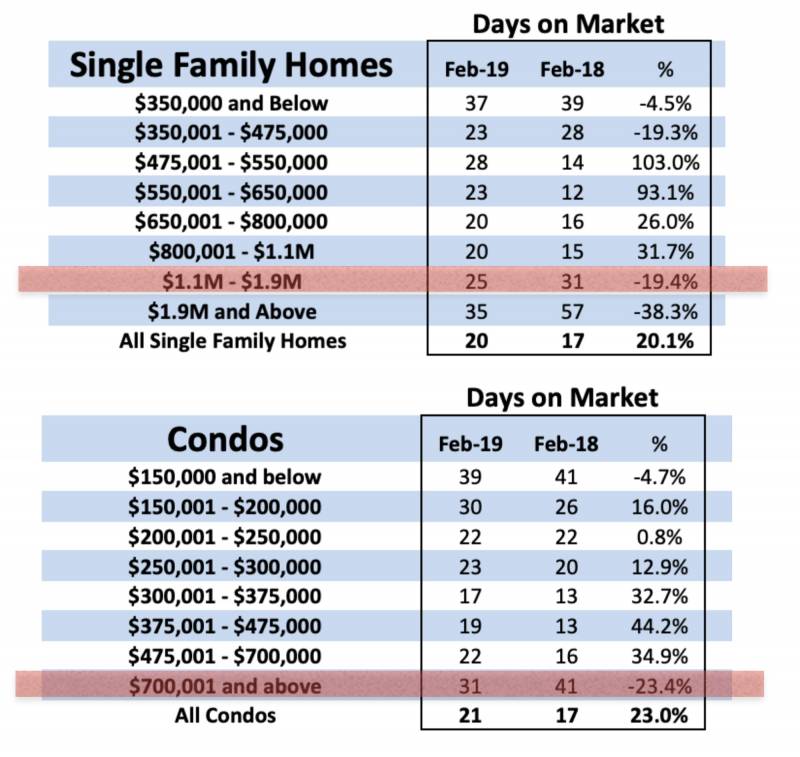
Price Points
If we compare market velocity and price point, on Oahu single family homes, we see it is fairly consistent at the low end of prices at around 20 days on the market to sell. Once we hit $1.1-$1.9M it takes 25% longer and then at $1.9M+, it jumps another 40% to 35 days to sell. The breaking point is at about $1.1M. Anything below that in single family homes, on average, is sold in several weeks and above that could take a months or more. For condominiums, the break occurs roughly at $700,000 (Source HBR).
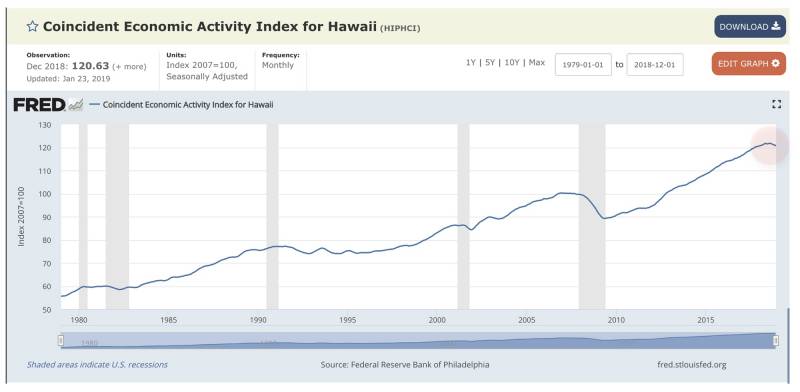
Economic Activity
The line in the graph represents an index that tracks Hawaii’s economic activity. We can see the last 5 US recessions highlighted in grey. Since the Spring of 2010, the index has recovered 31 points. You can see the tail end of the graph you can see signs of a potential peak or leveling off trend.
Visitor Spending, Days & Arrivals
DBEDT released preliminary January visitor numbers and expenditures declined by 3.8%, year over year. While visitor days and arrivals have modest gains.
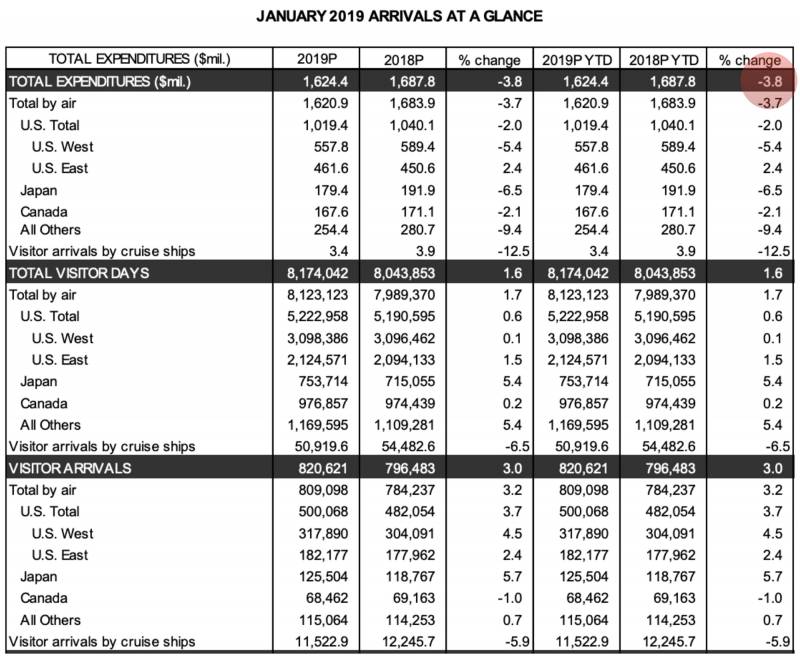
This is the first expenditures decrease since 2009. 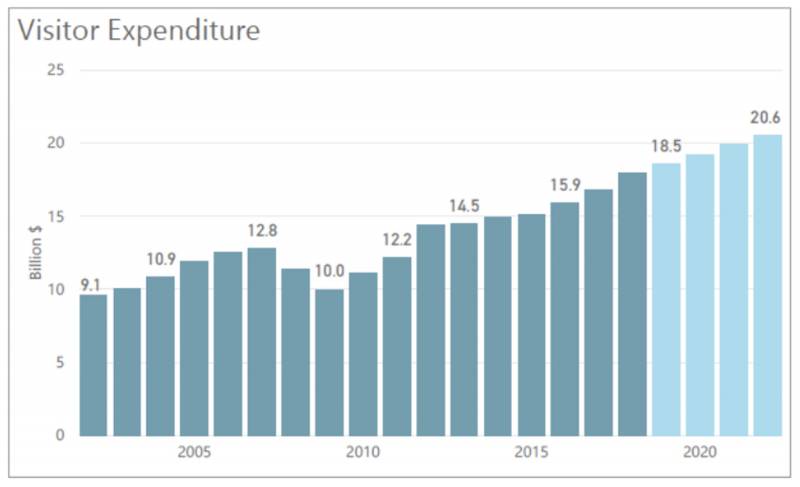
Summary
In summary, prices were up slightly for both categories and supply remains low, but on the rise. Market velocity is just over 3 weeks to sell property and there are signs of a shift in Hawaii’s economy from record-breaking highs.
We hope this statistical report was enjoyable and that you found it helpful.
Aloha,
Jake

Leave your opinion here. Please be nice. Your Email address will be kept private, this form is secure and we never spam you.