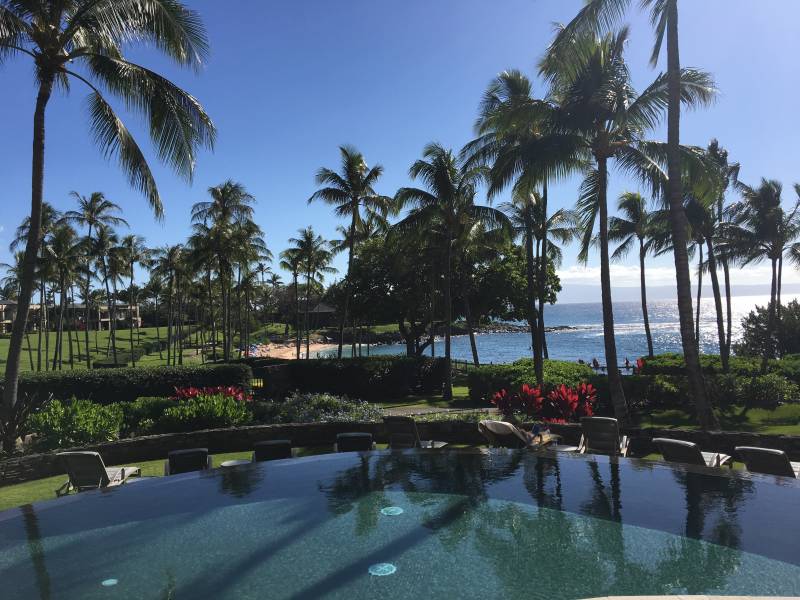
As part of my commitment to keeping the community informed about West Maui’s resort laden, micro-market real estate environment, I’m bringing you an up-to-date, comprehensive property market summary of the Montage Residences at Kapalua Bay, Kapalua’s exclusive, uber-luxurious, amenity infused oceanfront resort.
What You’ll Find
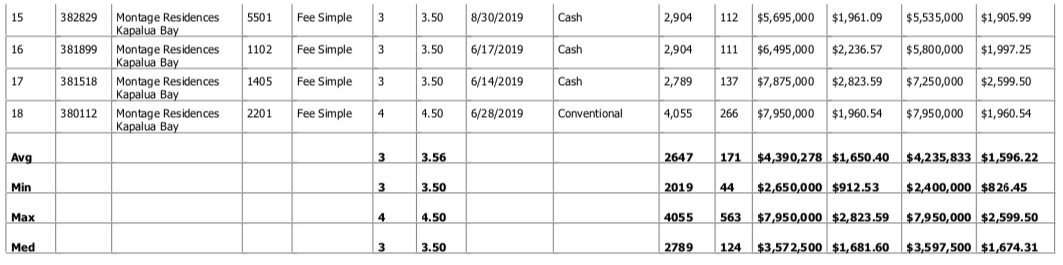
- Actual Sales Prices: learn exactly how much specific properties sold for
- Sales Volume: see the strength of the market in terms of how many properties sold
- Days on Market: understand how long it takes the average property to sell
- List Price vs. Sold Price: see how the final sales price compares to the listing price
- Price Per Square Foot: which is critical in calculating real estate values
- Asset % Growth: what is the yr over year appreciation if my property
- Current Inventory: what is actively for sale and currently under contract
Before we dig into the numbers, make sure you subscribe to my blog if you want to be notified of future market reports as they come available.

Market Snapshot
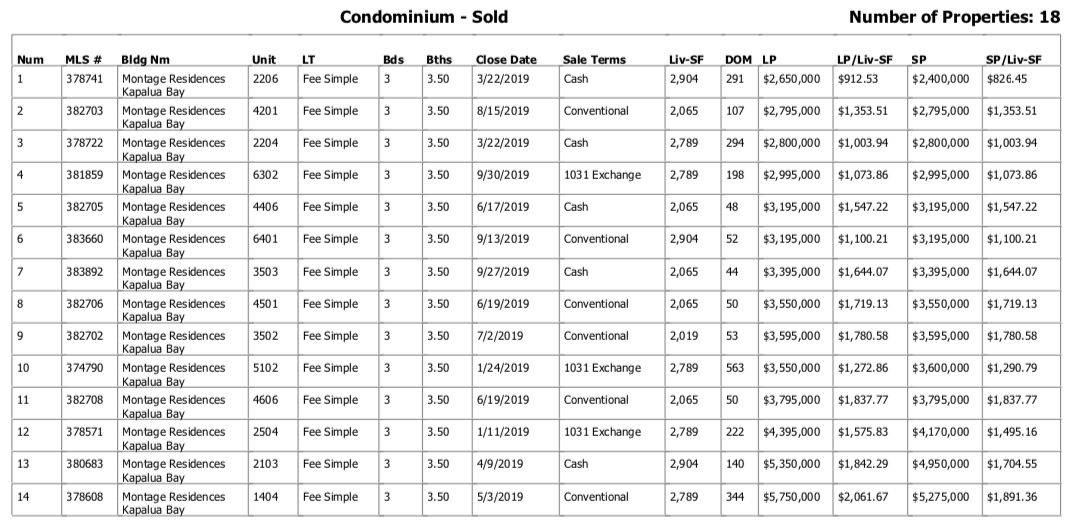
- Montage Kapalua Bay sales have been hot, to say the least in 2019, possibly even the hottest condo resort property in all of Hawaii. There have been 18 Montage Residences Kapalua sales this year and with one currently under contract.
- Sales prices remain exceptionally strong at the Montage, which is commanding 96% of list price and nearly a $4.5M average sale price in 2019. While on the surface, it looks like the prices have taken a dip, it’s a bit misleading as the Montage released Building #4’s Club Model units, which are smaller in size and set back farther from the ocean than the residence units (Hence, lower asking price).
- Days on Market from time of listing to closing is averaging 171 days
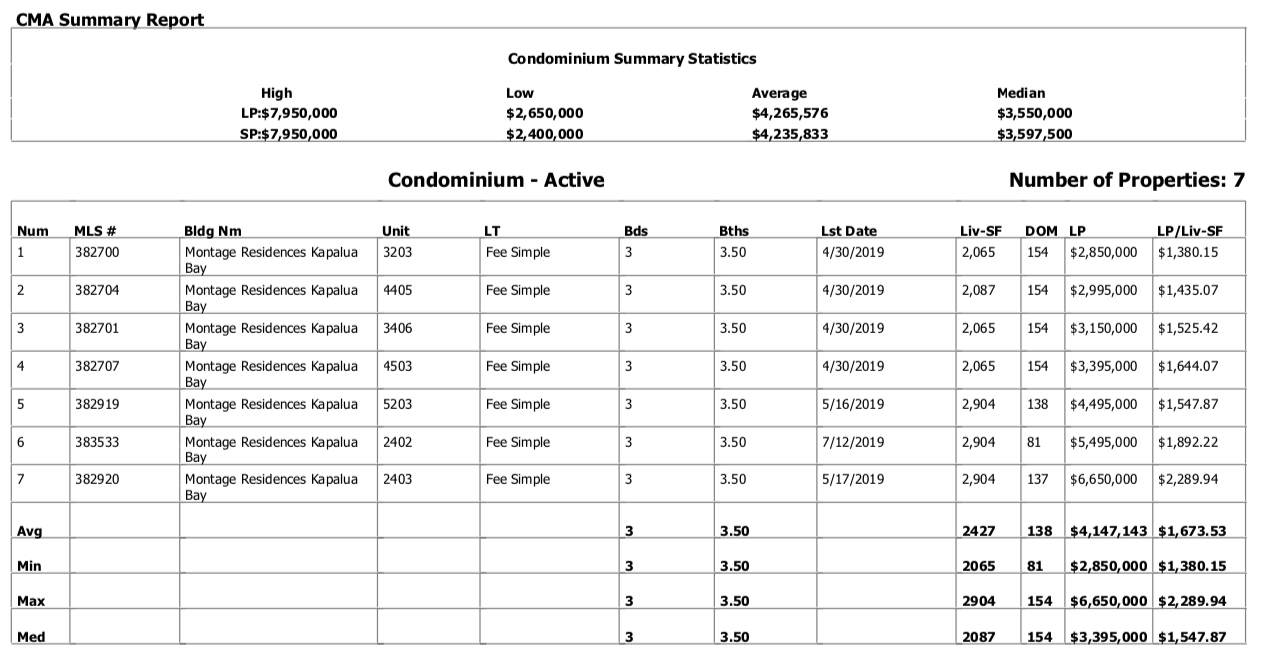
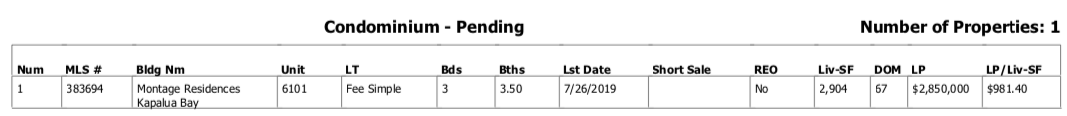
- Currently, there are 7 actively listed residences for sale and 1 under contract.
Montage Residences Kapalua Bay: Historical Sales Summary (click on the images/links for interactive)
| YEAR | Avg List Price | Avg Sale Price | Total Pr/Liv Sq ft | Avg – DOM | % of list price | Yr Gr | Total # Sold |
| 2019 | $4,390,278 | $4,235,833 | $1,596 | 210 | 96% | -13.5% | 18 |
| 2018 | $4,918,750 | $4,898,340 | $1,572 | 230 | 100% | 7.9% | 12 |
| 2017 | $4,591,818 | $4,541,364 | $1,587 | 96 | 99% | -0.3% | 11 |
| 2016 | $4,594,444 | $4,555,556 | $1,516 | 147 | 99% | 0.6% | 9 |
| 2015 | $4,530,000 | $4,530,000 | $1,609 | 168 | 100% | -22.5% | 9 |
| 2014 | $5,881,250 | $5,848,125 | $1,735 | 68 | 99% | 87.8% | 8 |
2019 Actives & Solds
Want to Know More?
If you are in the market for buying or selling Kapalua real estate or have any questions about the area or the market in general, please feel free to contact me. I welcome the opportunity to give you information on my previous sales performance and marketing strategies. Or if you’re curious about what your property is worth in today’s market, it would be my pleasure to provide you with property information and a value assessment free of any sales pitch.

Leave your opinion here. Please be nice. Your Email address will be kept private, this form is secure and we never spam you.